Immigrants from Singapore vs French Canadian Unemployment Among Ages 60 to 64 years
COMPARE
Immigrants from Singapore
French Canadian
Unemployment Among Ages 60 to 64 years
Unemployment Among Ages 60 to 64 years Comparison
Immigrants from Singapore
French Canadians
4.9%
UNEMPLOYMENT AMONG AGES 60 TO 64 YEARS
12.0/ 100
METRIC RATING
218th/ 347
METRIC RANK
4.8%
UNEMPLOYMENT AMONG AGES 60 TO 64 YEARS
87.6/ 100
METRIC RATING
136th/ 347
METRIC RANK
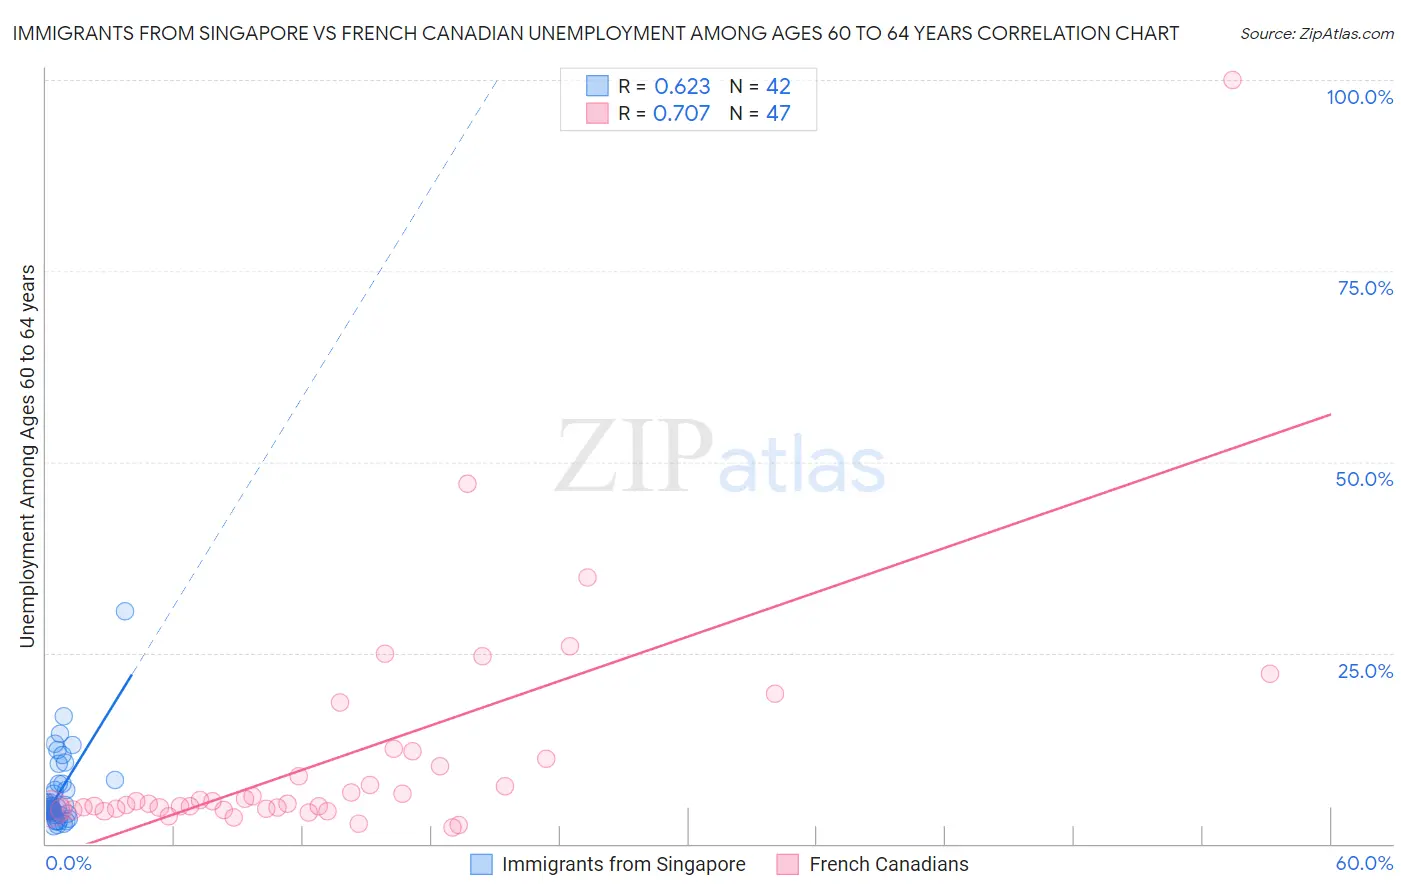
Immigrants from Singapore vs French Canadian Unemployment Among Ages 60 to 64 years Correlation Chart
The statistical analysis conducted on geographies consisting of 132,440,253 people shows a significant positive correlation between the proportion of Immigrants from Singapore and unemployment rate among population between the ages 60 and 64 in the United States with a correlation coefficient (R) of 0.623 and weighted average of 4.9%. Similarly, the statistical analysis conducted on geographies consisting of 428,566,208 people shows a strong positive correlation between the proportion of French Canadians and unemployment rate among population between the ages 60 and 64 in the United States with a correlation coefficient (R) of 0.707 and weighted average of 4.8%, a difference of 3.5%.
Unemployment Among Ages 60 to 64 years Correlation Summary
| Measurement | Immigrants from Singapore | French Canadian |
| Minimum | 2.3% | 2.1% |
| Maximum | 30.4% | 100.0% |
| Range | 28.1% | 97.9% |
| Mean | 6.8% | 11.3% |
| Median | 4.8% | 5.3% |
| Interquartile 25% (IQ1) | 3.9% | 4.5% |
| Interquartile 75% (IQ3) | 7.8% | 11.1% |
| Interquartile Range (IQR) | 3.9% | 6.6% |
| Standard Deviation (Sample) | 5.2% | 16.1% |
| Standard Deviation (Population) | 5.1% | 15.9% |
Similar Demographics by Unemployment Among Ages 60 to 64 years
Demographics Similar to Immigrants from Singapore by Unemployment Among Ages 60 to 64 years
In terms of unemployment among ages 60 to 64 years, the demographic groups most similar to Immigrants from Singapore are Korean (4.9%, a difference of 0.010%), Cajun (4.9%, a difference of 0.020%), Immigrants from Brazil (4.9%, a difference of 0.030%), Ottawa (4.9%, a difference of 0.040%), and Immigrants from South Eastern Asia (4.9%, a difference of 0.080%).
| Demographics | Rating | Rank | Unemployment Among Ages 60 to 64 years |
| Blackfeet | 15.7 /100 | #211 | Poor 4.9% |
| Moroccans | 15.0 /100 | #212 | Poor 4.9% |
| Eastern Europeans | 14.3 /100 | #213 | Poor 4.9% |
| Immigrants | Russia | 13.7 /100 | #214 | Poor 4.9% |
| Immigrants | South Eastern Asia | 13.1 /100 | #215 | Poor 4.9% |
| Cajuns | 12.3 /100 | #216 | Poor 4.9% |
| Koreans | 12.2 /100 | #217 | Poor 4.9% |
| Immigrants | Singapore | 12.0 /100 | #218 | Poor 4.9% |
| Immigrants | Brazil | 11.7 /100 | #219 | Poor 4.9% |
| Ottawa | 11.6 /100 | #220 | Poor 4.9% |
| Ugandans | 10.5 /100 | #221 | Poor 4.9% |
| Brazilians | 10.1 /100 | #222 | Poor 5.0% |
| Crow | 9.7 /100 | #223 | Tragic 5.0% |
| Immigrants | Cameroon | 8.5 /100 | #224 | Tragic 5.0% |
| Immigrants | Ireland | 7.2 /100 | #225 | Tragic 5.0% |
Demographics Similar to French Canadians by Unemployment Among Ages 60 to 64 years
In terms of unemployment among ages 60 to 64 years, the demographic groups most similar to French Canadians are Pennsylvania German (4.8%, a difference of 0.010%), Cambodian (4.8%, a difference of 0.050%), Immigrants from Lithuania (4.8%, a difference of 0.080%), Immigrants from Africa (4.8%, a difference of 0.080%), and Basque (4.8%, a difference of 0.10%).
| Demographics | Rating | Rank | Unemployment Among Ages 60 to 64 years |
| Immigrants | Serbia | 90.2 /100 | #129 | Exceptional 4.8% |
| Immigrants | Syria | 90.1 /100 | #130 | Exceptional 4.8% |
| Immigrants | Lebanon | 89.6 /100 | #131 | Excellent 4.8% |
| Lithuanians | 89.6 /100 | #132 | Excellent 4.8% |
| Yaqui | 89.5 /100 | #133 | Excellent 4.8% |
| Basques | 88.8 /100 | #134 | Excellent 4.8% |
| Pennsylvania Germans | 87.8 /100 | #135 | Excellent 4.8% |
| French Canadians | 87.6 /100 | #136 | Excellent 4.8% |
| Cambodians | 86.9 /100 | #137 | Excellent 4.8% |
| Immigrants | Lithuania | 86.7 /100 | #138 | Excellent 4.8% |
| Immigrants | Africa | 86.6 /100 | #139 | Excellent 4.8% |
| Pima | 85.8 /100 | #140 | Excellent 4.8% |
| Panamanians | 85.5 /100 | #141 | Excellent 4.8% |
| Immigrants | Ethiopia | 85.3 /100 | #142 | Excellent 4.8% |
| Italians | 85.0 /100 | #143 | Excellent 4.8% |