Immigrants from Sierra Leone vs Japanese Unemployment Among Ages 16 to 19 years
COMPARE
Immigrants from Sierra Leone
Japanese
Unemployment Among Ages 16 to 19 years
Unemployment Among Ages 16 to 19 years Comparison
Immigrants from Sierra Leone
Japanese
20.0%
UNEMPLOYMENT AMONG AGES 16 TO 19 YEARS
0.0/ 100
METRIC RATING
290th/ 347
METRIC RANK
17.6%
UNEMPLOYMENT AMONG AGES 16 TO 19 YEARS
43.2/ 100
METRIC RATING
186th/ 347
METRIC RANK
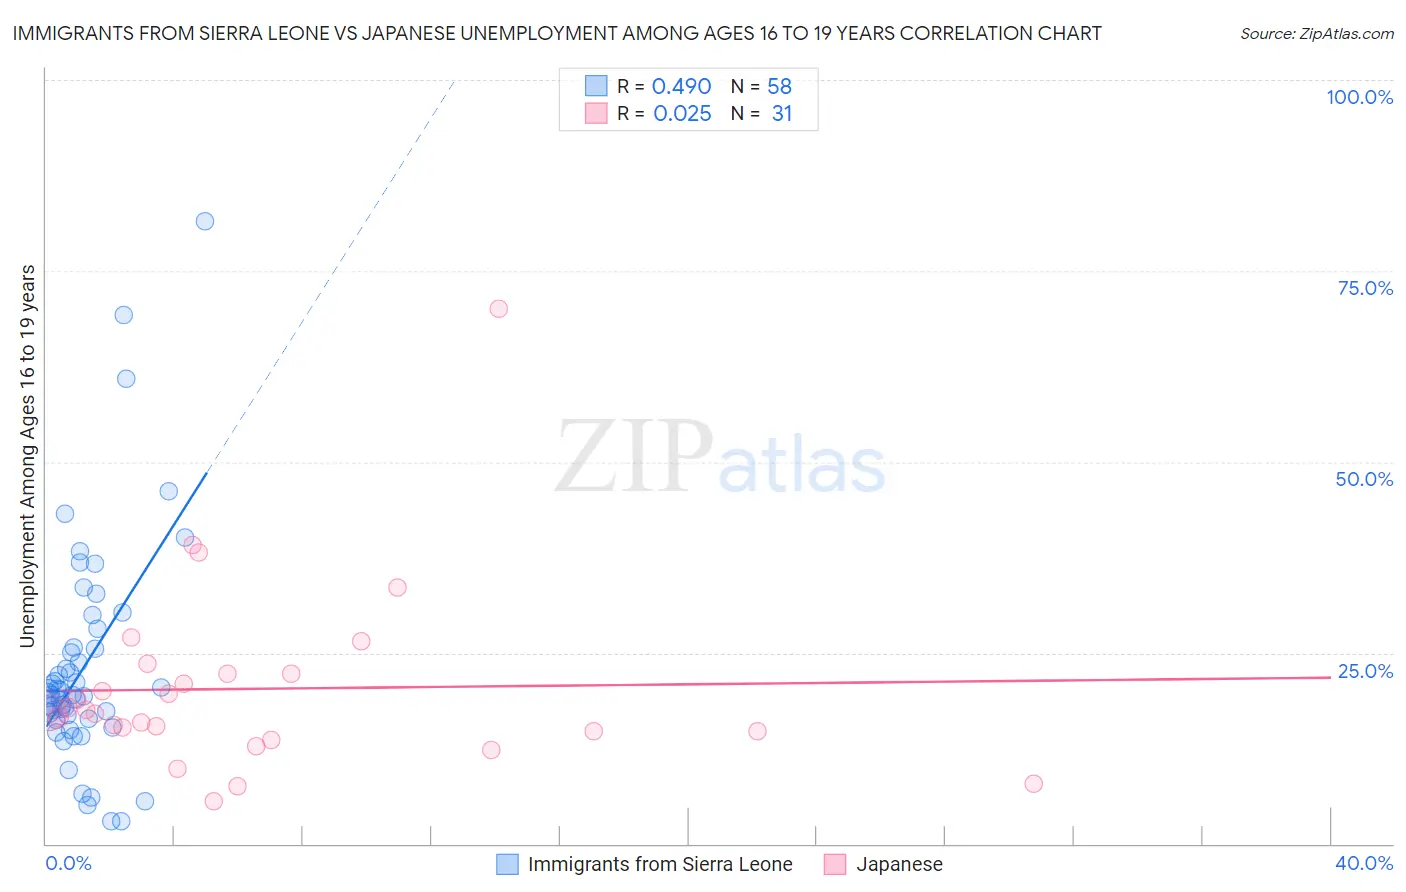
Immigrants from Sierra Leone vs Japanese Unemployment Among Ages 16 to 19 years Correlation Chart
The statistical analysis conducted on geographies consisting of 100,531,562 people shows a moderate positive correlation between the proportion of Immigrants from Sierra Leone and unemployment rate among population between the ages 16 and 19 in the United States with a correlation coefficient (R) of 0.490 and weighted average of 20.0%. Similarly, the statistical analysis conducted on geographies consisting of 242,998,538 people shows no correlation between the proportion of Japanese and unemployment rate among population between the ages 16 and 19 in the United States with a correlation coefficient (R) of 0.025 and weighted average of 17.6%, a difference of 13.2%.
Unemployment Among Ages 16 to 19 years Correlation Summary
| Measurement | Immigrants from Sierra Leone | Japanese |
| Minimum | 2.9% | 5.5% |
| Maximum | 81.5% | 70.0% |
| Range | 78.6% | 64.5% |
| Mean | 23.3% | 20.3% |
| Median | 19.5% | 17.2% |
| Interquartile 25% (IQ1) | 16.4% | 14.7% |
| Interquartile 75% (IQ3) | 25.7% | 22.3% |
| Interquartile Range (IQR) | 9.3% | 7.6% |
| Standard Deviation (Sample) | 14.7% | 12.2% |
| Standard Deviation (Population) | 14.6% | 12.0% |
Similar Demographics by Unemployment Among Ages 16 to 19 years
Demographics Similar to Immigrants from Sierra Leone by Unemployment Among Ages 16 to 19 years
In terms of unemployment among ages 16 to 19 years, the demographic groups most similar to Immigrants from Sierra Leone are Immigrants from Yemen (20.0%, a difference of 0.43%), Pueblo (19.8%, a difference of 0.53%), Immigrants from the Azores (19.8%, a difference of 0.70%), Immigrants from Ghana (19.8%, a difference of 0.83%), and Bahamian (19.8%, a difference of 0.89%).
| Demographics | Rating | Rank | Unemployment Among Ages 16 to 19 years |
| Sioux | 0.0 /100 | #283 | Tragic 19.7% |
| Sierra Leoneans | 0.0 /100 | #284 | Tragic 19.7% |
| Ghanaians | 0.0 /100 | #285 | Tragic 19.8% |
| Bahamians | 0.0 /100 | #286 | Tragic 19.8% |
| Immigrants | Ghana | 0.0 /100 | #287 | Tragic 19.8% |
| Immigrants | Azores | 0.0 /100 | #288 | Tragic 19.8% |
| Pueblo | 0.0 /100 | #289 | Tragic 19.8% |
| Immigrants | Sierra Leone | 0.0 /100 | #290 | Tragic 20.0% |
| Immigrants | Yemen | 0.0 /100 | #291 | Tragic 20.0% |
| Comanche | 0.0 /100 | #292 | Tragic 20.2% |
| Immigrants | Bahamas | 0.0 /100 | #293 | Tragic 20.4% |
| Immigrants | Haiti | 0.0 /100 | #294 | Tragic 20.4% |
| Central American Indians | 0.0 /100 | #295 | Tragic 20.4% |
| Armenians | 0.0 /100 | #296 | Tragic 20.5% |
| Alsatians | 0.0 /100 | #297 | Tragic 20.5% |
Demographics Similar to Japanese by Unemployment Among Ages 16 to 19 years
In terms of unemployment among ages 16 to 19 years, the demographic groups most similar to Japanese are Iroquois (17.6%, a difference of 0.010%), Immigrants from Micronesia (17.6%, a difference of 0.040%), Eastern European (17.6%, a difference of 0.050%), Immigrants from Nicaragua (17.6%, a difference of 0.050%), and Immigrants from Europe (17.6%, a difference of 0.060%).
| Demographics | Rating | Rank | Unemployment Among Ages 16 to 19 years |
| Americans | 47.4 /100 | #179 | Average 17.6% |
| Spaniards | 47.1 /100 | #180 | Average 17.6% |
| Immigrants | Turkey | 45.6 /100 | #181 | Average 17.6% |
| Russians | 45.2 /100 | #182 | Average 17.6% |
| Immigrants | Uruguay | 44.6 /100 | #183 | Average 17.6% |
| Eastern Europeans | 44.3 /100 | #184 | Average 17.6% |
| Iroquois | 43.4 /100 | #185 | Average 17.6% |
| Japanese | 43.2 /100 | #186 | Average 17.6% |
| Immigrants | Micronesia | 42.4 /100 | #187 | Average 17.6% |
| Immigrants | Nicaragua | 42.2 /100 | #188 | Average 17.6% |
| Immigrants | Europe | 41.8 /100 | #189 | Average 17.6% |
| Marshallese | 41.7 /100 | #190 | Average 17.6% |
| Immigrants | Costa Rica | 41.3 /100 | #191 | Average 17.6% |
| Immigrants | Philippines | 40.7 /100 | #192 | Average 17.7% |
| Immigrants | Australia | 40.6 /100 | #193 | Average 17.7% |