Immigrants from Sierra Leone vs Immigrants from Congo Unemployment Among Ages 35 to 44 years

COMPARE

Immigrants from Sierra Leone
Race
Ancestry
AfghanAfricanAlaska NativeAlaskan AthabascanAlbanianAleutAlsatianAmericanApacheArabArapahoArgentineanArmenianAssyrian/Chaldean/SyriacAustralianAustrianBahamianBangladeshiBarbadianBasqueBelgianBelizeanBermudanBhutaneseBlackfeetBolivianBrazilianBritishBritish West IndianBulgarianBurmeseCajunCambodianCanadianCape VerdeanCarpatho RusynCelticCentral AmericanCentral American IndianCherokeeCheyenneChickasawChileanChineseChippewaChoctawColombianColvilleComancheCosta RicanCreeCreekCroatianCrowCubanCypriotCzechCzechoslovakianDanishDelawareDominicanDutchDutch West IndianEastern EuropeanEcuadorianEgyptianEnglishEstonianEthiopianEuropeanFijianFilipinoFinnishFrenchFrench American IndianFrench CanadianGermanGerman RussianGhanaianGreekGuamanian/ChamorroGuatemalanGuyaneseHaitianHmongHonduranHopiHoumaHungarianIcelanderIndian (Asian)IndonesianInupiatIranianIraqiIrishIroquoisIsraeliItalianJamaicanJapaneseJordanianKenyanKiowaKoreanLaotianLatvianLebaneseLiberianLithuanianLumbeeLuxembourgerMacedonianMalaysianMalteseMarshalleseMenomineeMexicanMexican American IndianMongolianMoroccanNative HawaiianNavajoNepaleseNew ZealanderNicaraguanNigerianNorthern EuropeanNorwegianOkinawanOsageOttawaPaiutePakistaniPalestinianPanamanianParaguayanPennsylvania GermanPeruvianPimaPolishPortuguesePotawatomiPuebloPuerto RicanPuget Sound SalishRomanianRussianSalvadoranSamoanScandinavianScotch-IrishScottishSeminoleSenegaleseSerbianShoshoneSierra LeoneanSiouxSlavicSlovakSloveneSomaliSouth AfricanSouth AmericanSouth American IndianSoviet UnionSpaniardSpanishSpanish AmericanSpanish American IndianSri LankanSubsaharan AfricanSudaneseSwedishSwissSyrianTaiwaneseThaiTlingit-HaidaTohono O'OdhamTonganTrinidadian and TobagonianTsimshianTurkishU.S. Virgin IslanderUgandanUkrainianUruguayanUteVenezuelanVietnameseWelshWest IndianYakamaYaquiYugoslavianYumanYup'ikZimbabwean
Immigration
NonimmigrantsImmigrantsAfghanistanAfricaAlbaniaArgentinaArmeniaAsiaAustraliaAustriaBahamasBangladeshBarbadosBelarusBelgiumBelizeBoliviaBosnia and HerzegovinaBrazilBulgariaBurma/MyanmarCabo VerdeCambodiaCameroonCanadaCaribbeanCentral AmericaChileChinaColombiaCosta RicaCroatiaCubaCzechoslovakiaDenmarkDominicaDominican RepublicEastern AfricaEastern AsiaEastern EuropeEcuadorEgyptEl SalvadorEnglandEritreaEthiopiaEuropeFijiFranceGermanyGhanaGreeceGrenadaGuatemalaGuyanaHaitiHondurasHong KongHungaryIndiaIndonesiaIranIraqIrelandIsraelItalyJamaicaJapanJordanKazakhstanKenyaKoreaKuwaitLaosLatin AmericaLatviaLebanonLiberiaLithuaniaMalaysiaMexicoMicronesiaMiddle AfricaMoldovaMoroccoNepalNetherlandsNicaraguaNigeriaNorth AmericaNorth MacedoniaNorthern AfricaNorthern EuropeNorwayOceaniaPakistanPanamaPeruPhilippinesPolandPortugalRomaniaRussiaSaudi ArabiaScotlandSenegalSerbiaSierra LeoneSingaporeSomaliaSouth AfricaSouth AmericaSouth Central AsiaSouth Eastern AsiaSouthern EuropeSpainSri LankaSt. Vincent and the GrenadinesSudanSwedenSwitzerlandSyriaTaiwanThailandTrinidad and TobagoTurkeyUgandaUkraineUruguayUzbekistanVenezuelaVietnamWest IndiesWestern AfricaWestern AsiaWestern EuropeYemenZaireZimbabweAzores
Immigrants from Congo
Race
Ancestry
AfghanAfricanAlaska NativeAlaskan AthabascanAlbanianAleutAlsatianAmericanApacheArabArapahoArgentineanArmenianAssyrian/Chaldean/SyriacAustralianAustrianBahamianBangladeshiBarbadianBasqueBelgianBelizeanBermudanBhutaneseBlackfeetBolivianBrazilianBritishBritish West IndianBulgarianBurmeseCajunCambodianCanadianCape VerdeanCarpatho RusynCelticCentral AmericanCentral American IndianCherokeeCheyenneChickasawChileanChineseChippewaChoctawColombianColvilleComancheCosta RicanCreeCreekCroatianCrowCubanCypriotCzechCzechoslovakianDanishDelawareDominicanDutchDutch West IndianEastern EuropeanEcuadorianEgyptianEnglishEstonianEthiopianEuropeanFijianFilipinoFinnishFrenchFrench American IndianFrench CanadianGermanGerman RussianGhanaianGreekGuamanian/ChamorroGuatemalanGuyaneseHaitianHmongHonduranHopiHoumaHungarianIcelanderIndian (Asian)IndonesianInupiatIranianIraqiIrishIroquoisIsraeliItalianJamaicanJapaneseJordanianKenyanKiowaKoreanLaotianLatvianLebaneseLiberianLithuanianLumbeeLuxembourgerMacedonianMalaysianMalteseMarshalleseMenomineeMexicanMexican American IndianMongolianMoroccanNative HawaiianNavajoNepaleseNew ZealanderNicaraguanNigerianNorthern EuropeanNorwegianOkinawanOsageOttawaPaiutePakistaniPalestinianPanamanianParaguayanPennsylvania GermanPeruvianPimaPolishPortuguesePotawatomiPuebloPuerto RicanPuget Sound SalishRomanianRussianSalvadoranSamoanScandinavianScotch-IrishScottishSeminoleSenegaleseSerbianShoshoneSierra LeoneanSiouxSlavicSlovakSloveneSomaliSouth AfricanSouth AmericanSouth American IndianSoviet UnionSpaniardSpanishSpanish AmericanSpanish American IndianSri LankanSubsaharan AfricanSudaneseSwedishSwissSyrianTaiwaneseThaiTlingit-HaidaTohono O'OdhamTonganTrinidadian and TobagonianTsimshianTurkishU.S. Virgin IslanderUgandanUkrainianUruguayanUteVenezuelanVietnameseWelshWest IndianYakamaYaquiYugoslavianYumanYup'ikZimbabwean
Immigration
NonimmigrantsImmigrantsAfghanistanAfricaAlbaniaArgentinaArmeniaAsiaAustraliaAustriaBahamasBangladeshBarbadosBelarusBelgiumBelizeBoliviaBosnia and HerzegovinaBrazilBulgariaBurma/MyanmarCabo VerdeCambodiaCameroonCanadaCaribbeanCentral AmericaChileChinaColombiaCongoCosta RicaCroatiaCubaCzechoslovakiaDenmarkDominicaDominican RepublicEastern AfricaEastern AsiaEastern EuropeEcuadorEgyptEl SalvadorEnglandEritreaEthiopiaEuropeFijiFranceGermanyGhanaGreeceGrenadaGuatemalaGuyanaHaitiHondurasHong KongHungaryIndiaIndonesiaIranIraqIrelandIsraelItalyJamaicaJapanJordanKazakhstanKenyaKoreaKuwaitLaosLatin AmericaLatviaLebanonLiberiaLithuaniaMalaysiaMexicoMicronesiaMiddle AfricaMoldovaMoroccoNepalNetherlandsNicaraguaNigeriaNorth AmericaNorth MacedoniaNorthern AfricaNorthern EuropeNorwayOceaniaPakistanPanamaPeruPhilippinesPolandPortugalRomaniaRussiaSaudi ArabiaScotlandSenegalSerbiaSingaporeSomaliaSouth AfricaSouth AmericaSouth Central AsiaSouth Eastern AsiaSouthern EuropeSpainSri LankaSt. Vincent and the GrenadinesSudanSwedenSwitzerlandSyriaTaiwanThailandTrinidad and TobagoTurkeyUgandaUkraineUruguayUzbekistanVenezuelaVietnamWest IndiesWestern AfricaWestern AsiaWestern EuropeYemenZaireZimbabweAzores
Unemployment Among Ages 35 to 44 years
Income
Poverty
Unemployment
Labor Participation
Family Structure
Vehicle Availability
Education Level
Disability

Unemployment Among Ages 35 to 44 years Comparison

Immigrants from Sierra Leone

Immigrants from Congo

Tragic
Fair
4.9%
UNEMPLOYMENT AMONG AGES 35 TO 44 YEARS
4.7/ 100
METRIC RATING
220th/ 347
METRIC RANK
4.7%
UNEMPLOYMENT AMONG AGES 35 TO 44 YEARS
33.9/ 100
METRIC RATING
189th/ 347
METRIC RANK

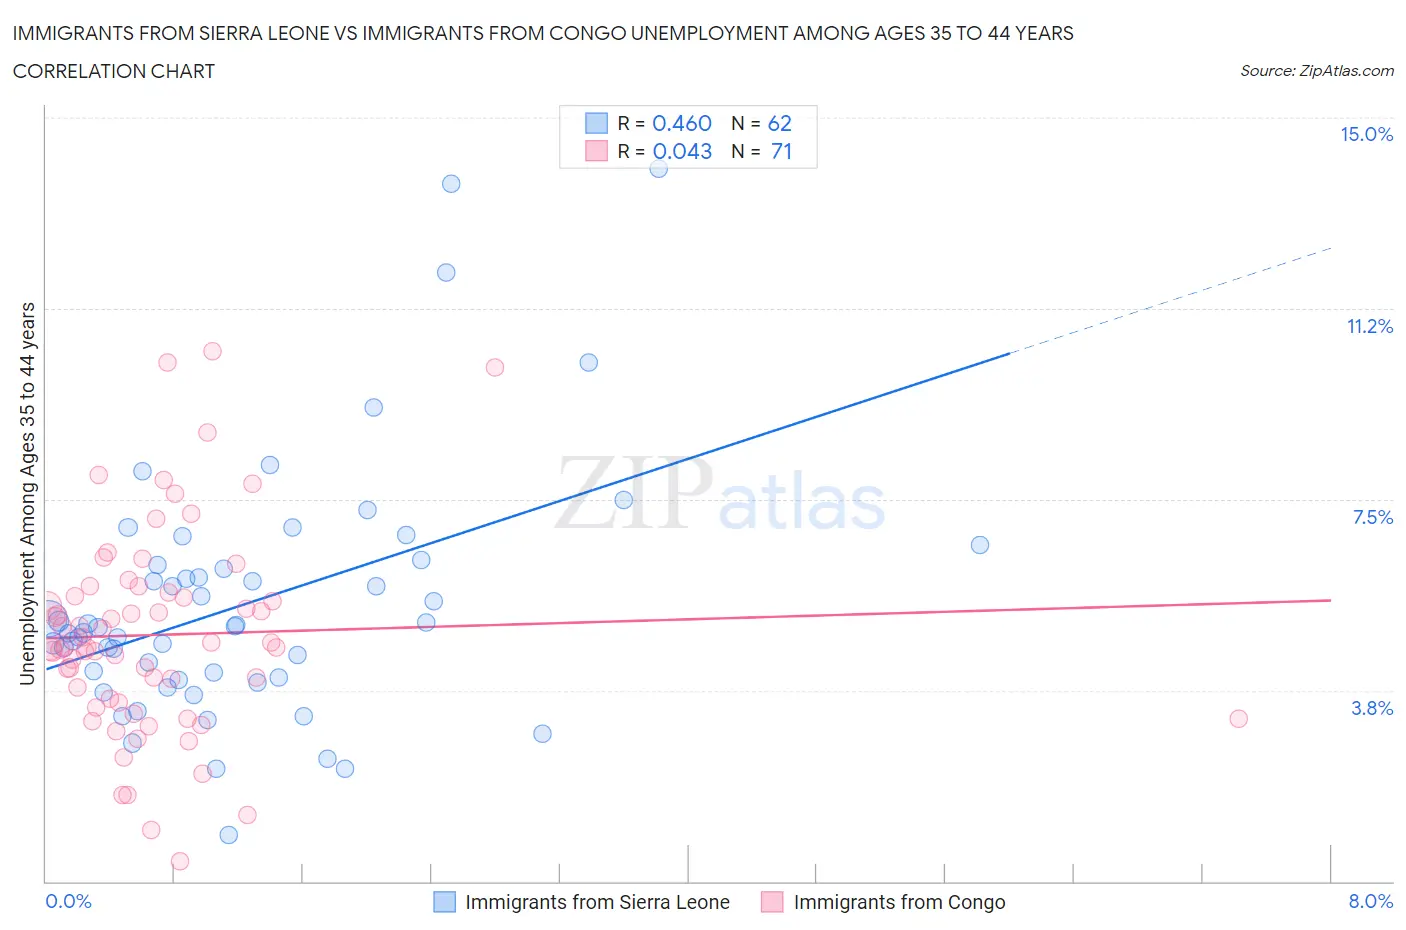
Immigrants from Sierra Leone vs Immigrants from Congo Unemployment Among Ages 35 to 44 years Correlation Chart

The statistical analysis conducted on geographies consisting of 101,194,728 people shows a moderate positive correlation between the proportion of Immigrants from Sierra Leone and unemployment rate among population between the ages 35 and 44 in the United States with a correlation coefficient (R) of 0.460 and weighted average of 4.9%. Similarly, the statistical analysis conducted on geographies consisting of 91,826,313 people shows no correlation between the proportion of Immigrants from Congo and unemployment rate among population between the ages 35 and 44 in the United States with a correlation coefficient (R) of 0.043 and weighted average of 4.7%, a difference of 4.1%.
Immigrants from Sierra Leone vs Immigrants from Congo Unemployment Among Ages 35 to 44 years

Unemployment Among Ages 35 to 44 years Correlation Summary

MeasurementImmigrants from Sierra LeoneImmigrants from Congo
Minimum0.90%0.40%
Maximum14.0%10.4%
Range13.1%10.0%
Mean5.5%4.8%
Median5.0%4.6%
Interquartile 25% (IQ1)4.0%3.5%
Interquartile 75% (IQ3)6.2%5.7%
Interquartile Range (IQR)2.2%2.2%
Standard Deviation (Sample)2.5%2.0%
Standard Deviation (Population)2.4%2.0%

Similar Demographics by Unemployment Among Ages 35 to 44 years

Demographics Similar to Immigrants from Sierra Leone by Unemployment Among Ages 35 to 44 years

In terms of unemployment among ages 35 to 44 years, the demographic groups most similar to Immigrants from Sierra Leone are Sierra Leonean (4.9%, a difference of 0.030%), Bermudan (5.0%, a difference of 0.32%), Chickasaw (4.9%, a difference of 0.34%), Moroccan (4.9%, a difference of 0.45%), and American (4.9%, a difference of 0.49%).
DemographicsRating | RankUnemployment Among Ages 35 to 44 years
Osage
8.6
/100
|
#213
Tragic
4.9%
Immigrants | Africa
8.2
/100
|
#214
Tragic
4.9%
Immigrants | Immigrants
8.0
/100
|
#215
Tragic
4.9%
Americans
6.2
/100
|
#216
Tragic
4.9%
Moroccans
6.0
/100
|
#217
Tragic
4.9%
Chickasaw
5.7
/100
|
#218
Tragic
4.9%
Sierra Leoneans
4.8
/100
|
#219
Tragic
4.9%
Immigrants | Sierra Leone
4.7
/100
|
#220
Tragic
4.9%
Bermudans
3.9
/100
|
#221
Tragic
5.0%
Hmong
3.5
/100
|
#222
Tragic
5.0%
Immigrants | Panama
3.3
/100
|
#223
Tragic
5.0%
Panamanians
2.9
/100
|
#224
Tragic
5.0%
Immigrants | Lebanon
2.7
/100
|
#225
Tragic
5.0%
Potawatomi
2.5
/100
|
#226
Tragic
5.0%
Immigrants | Uzbekistan
1.9
/100
|
#227
Tragic
5.0%

Demographics Similar to Immigrants from Congo by Unemployment Among Ages 35 to 44 years

In terms of unemployment among ages 35 to 44 years, the demographic groups most similar to Immigrants from Congo are Immigrants from Southern Europe (4.7%, a difference of 0.010%), Immigrants from South America (4.7%, a difference of 0.010%), Immigrants from Laos (4.7%, a difference of 0.040%), Malaysian (4.7%, a difference of 0.12%), and Cypriot (4.7%, a difference of 0.19%).
DemographicsRating | RankUnemployment Among Ages 35 to 44 years
Israelis
38.5
/100
|
#182
Fair
4.7%
Immigrants | Poland
37.9
/100
|
#183
Fair
4.7%
Immigrants | Zaire
37.3
/100
|
#184
Fair
4.7%
Immigrants | Costa Rica
37.0
/100
|
#185
Fair
4.7%
Cypriots
36.5
/100
|
#186
Fair
4.7%
Malaysians
35.5
/100
|
#187
Fair
4.7%
Immigrants | Laos
34.5
/100
|
#188
Fair
4.7%
Immigrants | Congo
33.9
/100
|
#189
Fair
4.7%
Immigrants | Southern Europe
33.8
/100
|
#190
Fair
4.7%
Immigrants | South America
33.8
/100
|
#191
Fair
4.7%
Immigrants | Albania
30.5
/100
|
#192
Fair
4.8%
Spanish
30.4
/100
|
#193
Fair
4.8%
Koreans
28.1
/100
|
#194
Fair
4.8%
Bangladeshis
28.0
/100
|
#195
Fair
4.8%
Immigrants | Syria
23.6
/100
|
#196
Fair
4.8%