Immigrants from Serbia vs Immigrants from Northern Africa Unemployment Among Youth under 25 years
COMPARE
Immigrants from Serbia
Immigrants from Northern Africa
Unemployment Among Youth under 25 years
Unemployment Among Youth under 25 years Comparison
Immigrants from Serbia
Immigrants from Northern Africa
11.3%
UNEMPLOYMENT AMONG YOUTH UNDER 25 YEARS
94.4/ 100
METRIC RATING
96th/ 347
METRIC RANK
11.5%
UNEMPLOYMENT AMONG YOUTH UNDER 25 YEARS
62.7/ 100
METRIC RATING
162nd/ 347
METRIC RANK
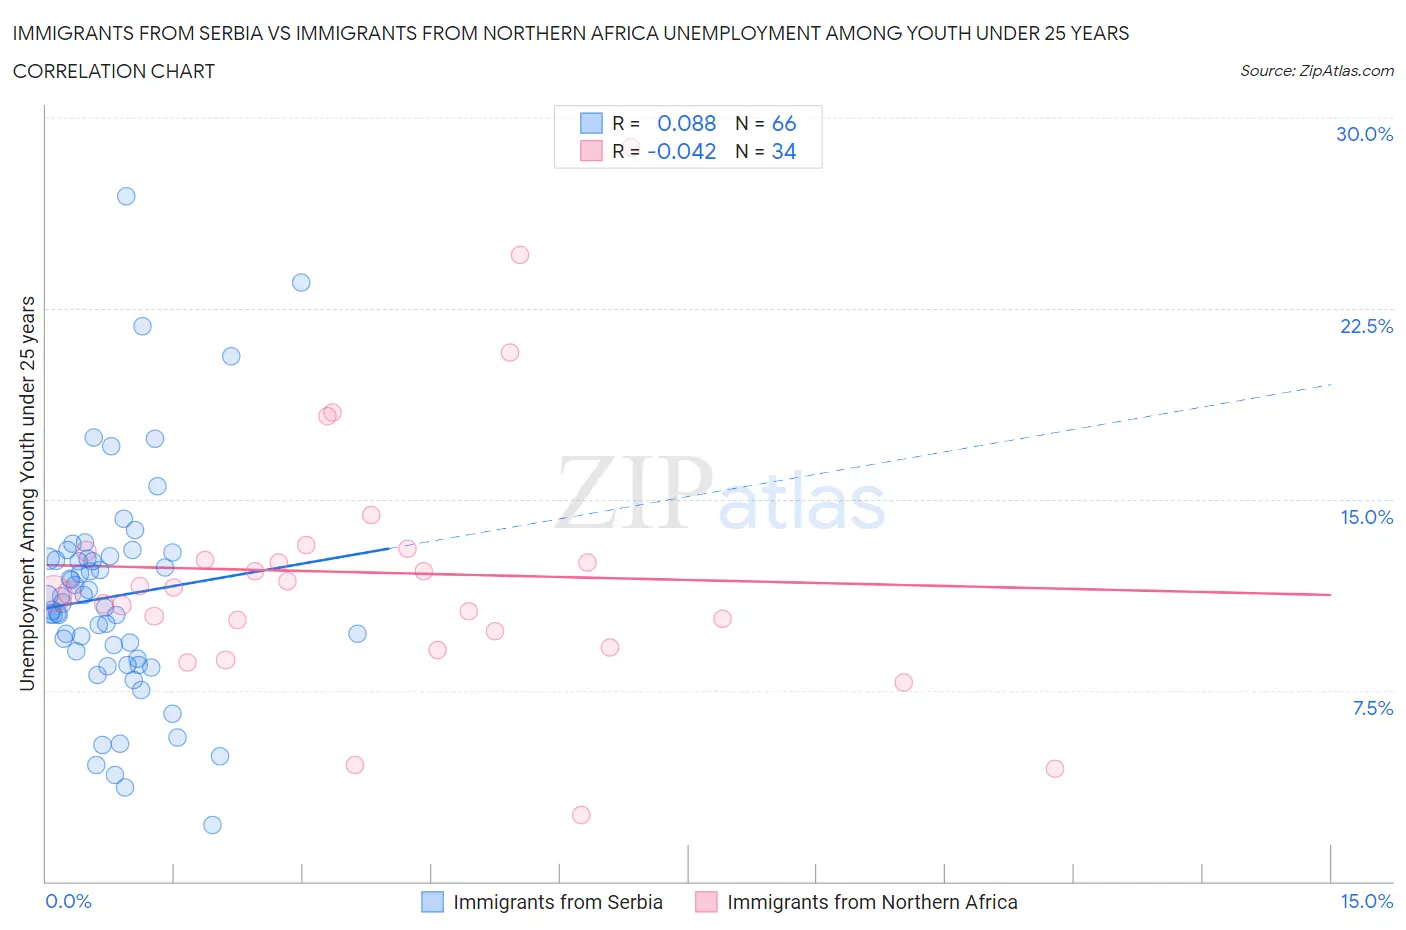
Immigrants from Serbia vs Immigrants from Northern Africa Unemployment Among Youth under 25 years Correlation Chart
The statistical analysis conducted on geographies consisting of 131,220,496 people shows a slight positive correlation between the proportion of Immigrants from Serbia and unemployment rate among youth under the age of 25 in the United States with a correlation coefficient (R) of 0.088 and weighted average of 11.3%. Similarly, the statistical analysis conducted on geographies consisting of 318,997,087 people shows no correlation between the proportion of Immigrants from Northern Africa and unemployment rate among youth under the age of 25 in the United States with a correlation coefficient (R) of -0.042 and weighted average of 11.5%, a difference of 2.4%.
Unemployment Among Youth under 25 years Correlation Summary
| Measurement | Immigrants from Serbia | Immigrants from Northern Africa |
| Minimum | 2.2% | 2.6% |
| Maximum | 26.9% | 28.8% |
| Range | 24.7% | 26.2% |
| Mean | 11.2% | 12.1% |
| Median | 10.8% | 11.4% |
| Interquartile 25% (IQ1) | 8.7% | 9.8% |
| Interquartile 75% (IQ3) | 12.7% | 13.0% |
| Interquartile Range (IQR) | 3.9% | 3.1% |
| Standard Deviation (Sample) | 4.4% | 5.2% |
| Standard Deviation (Population) | 4.4% | 5.1% |
Similar Demographics by Unemployment Among Youth under 25 years
Demographics Similar to Immigrants from Serbia by Unemployment Among Youth under 25 years
In terms of unemployment among youth under 25 years, the demographic groups most similar to Immigrants from Serbia are Carpatho Rusyn (11.3%, a difference of 0.010%), Nicaraguan (11.3%, a difference of 0.020%), Estonian (11.3%, a difference of 0.020%), Celtic (11.3%, a difference of 0.070%), and Pakistani (11.3%, a difference of 0.080%).
| Demographics | Rating | Rank | Unemployment Among Youth under 25 years |
| Immigrants | Japan | 95.5 /100 | #89 | Exceptional 11.2% |
| Immigrants | Bolivia | 95.5 /100 | #90 | Exceptional 11.2% |
| Immigrants | Taiwan | 95.1 /100 | #91 | Exceptional 11.2% |
| Immigrants | Latvia | 95.1 /100 | #92 | Exceptional 11.2% |
| Immigrants | North America | 95.1 /100 | #93 | Exceptional 11.2% |
| Lithuanians | 94.8 /100 | #94 | Exceptional 11.3% |
| Carpatho Rusyns | 94.4 /100 | #95 | Exceptional 11.3% |
| Immigrants | Serbia | 94.4 /100 | #96 | Exceptional 11.3% |
| Nicaraguans | 94.3 /100 | #97 | Exceptional 11.3% |
| Estonians | 94.2 /100 | #98 | Exceptional 11.3% |
| Celtics | 94.0 /100 | #99 | Exceptional 11.3% |
| Pakistanis | 94.0 /100 | #100 | Exceptional 11.3% |
| Iroquois | 93.8 /100 | #101 | Exceptional 11.3% |
| Immigrants | Thailand | 93.6 /100 | #102 | Exceptional 11.3% |
| Immigrants | Malaysia | 93.6 /100 | #103 | Exceptional 11.3% |
Demographics Similar to Immigrants from Northern Africa by Unemployment Among Youth under 25 years
In terms of unemployment among youth under 25 years, the demographic groups most similar to Immigrants from Northern Africa are Immigrants from Kazakhstan (11.5%, a difference of 0.0%), Immigrants from Laos (11.5%, a difference of 0.010%), Immigrants from Sweden (11.5%, a difference of 0.060%), Ukrainian (11.5%, a difference of 0.070%), and Immigrants from Eastern Asia (11.5%, a difference of 0.080%).
| Demographics | Rating | Rank | Unemployment Among Youth under 25 years |
| Immigrants | Romania | 66.3 /100 | #155 | Good 11.5% |
| Immigrants | Germany | 65.9 /100 | #156 | Good 11.5% |
| Indians (Asian) | 65.1 /100 | #157 | Good 11.5% |
| Immigrants | Turkey | 64.8 /100 | #158 | Good 11.5% |
| Immigrants | Western Europe | 64.7 /100 | #159 | Good 11.5% |
| Immigrants | Eastern Asia | 64.5 /100 | #160 | Good 11.5% |
| Ukrainians | 64.3 /100 | #161 | Good 11.5% |
| Immigrants | Northern Africa | 62.7 /100 | #162 | Good 11.5% |
| Immigrants | Kazakhstan | 62.7 /100 | #163 | Good 11.5% |
| Immigrants | Laos | 62.4 /100 | #164 | Good 11.5% |
| Immigrants | Sweden | 61.3 /100 | #165 | Good 11.5% |
| Spanish | 60.3 /100 | #166 | Good 11.6% |
| Okinawans | 58.7 /100 | #167 | Average 11.6% |
| Potawatomi | 57.9 /100 | #168 | Average 11.6% |
| Eastern Europeans | 57.5 /100 | #169 | Average 11.6% |