Immigrants from Serbia vs Immigrants from Africa Unemployment Among Ages 35 to 44 years
COMPARE
Immigrants from Serbia
Immigrants from Africa
Unemployment Among Ages 35 to 44 years
Unemployment Among Ages 35 to 44 years Comparison
Immigrants from Serbia
Immigrants from Africa
4.4%
UNEMPLOYMENT AMONG AGES 35 TO 44 YEARS
97.0/ 100
METRIC RATING
64th/ 347
METRIC RANK
4.9%
UNEMPLOYMENT AMONG AGES 35 TO 44 YEARS
8.2/ 100
METRIC RATING
214th/ 347
METRIC RANK
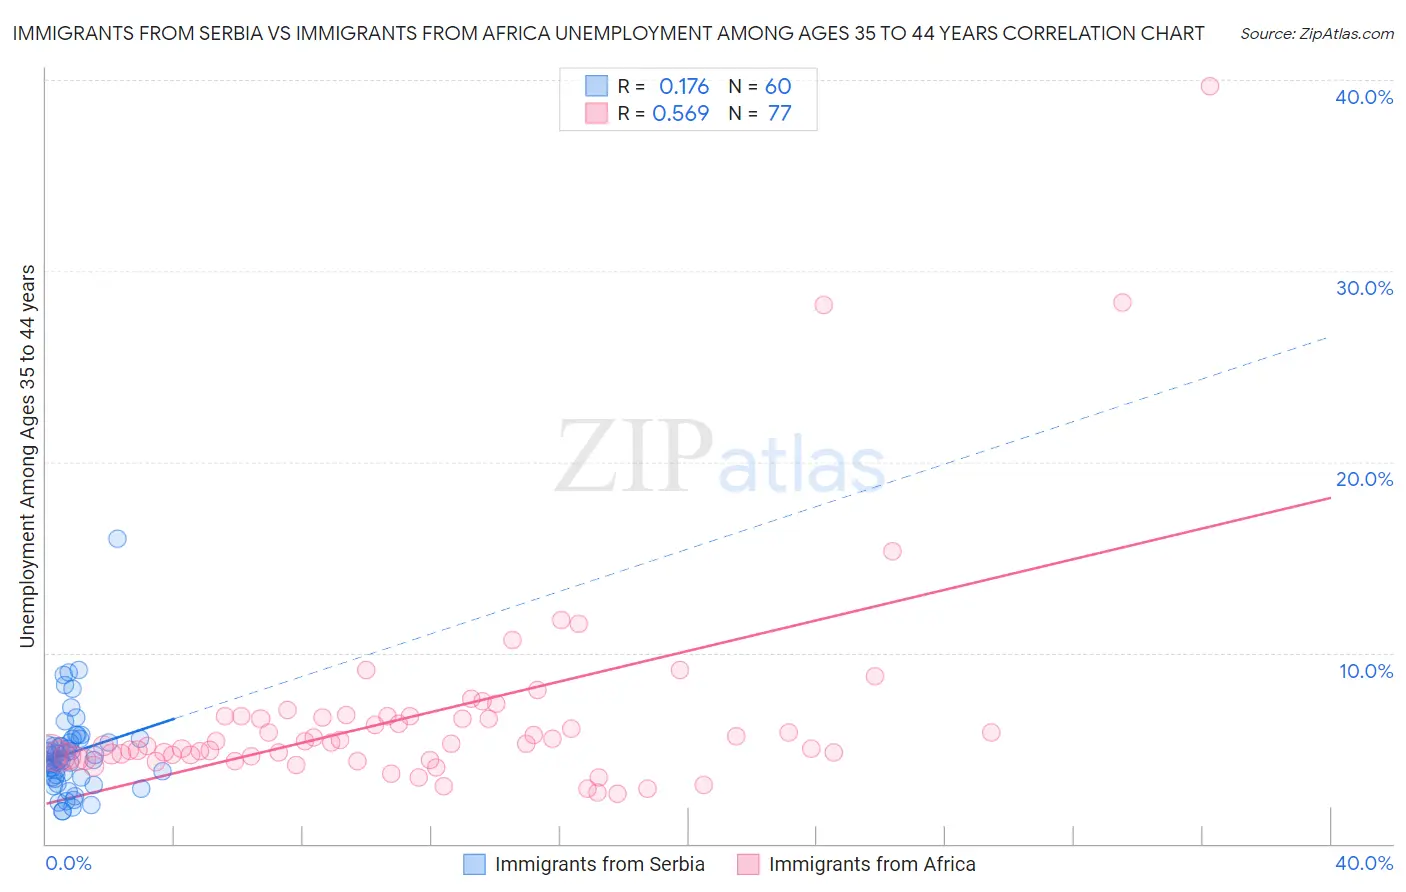
Immigrants from Serbia vs Immigrants from Africa Unemployment Among Ages 35 to 44 years Correlation Chart
The statistical analysis conducted on geographies consisting of 130,900,355 people shows a poor positive correlation between the proportion of Immigrants from Serbia and unemployment rate among population between the ages 35 and 44 in the United States with a correlation coefficient (R) of 0.176 and weighted average of 4.4%. Similarly, the statistical analysis conducted on geographies consisting of 456,052,465 people shows a substantial positive correlation between the proportion of Immigrants from Africa and unemployment rate among population between the ages 35 and 44 in the United States with a correlation coefficient (R) of 0.569 and weighted average of 4.9%, a difference of 11.1%.
Unemployment Among Ages 35 to 44 years Correlation Summary
| Measurement | Immigrants from Serbia | Immigrants from Africa |
| Minimum | 1.7% | 2.6% |
| Maximum | 16.0% | 39.7% |
| Range | 14.3% | 37.1% |
| Mean | 4.8% | 6.7% |
| Median | 4.4% | 5.2% |
| Interquartile 25% (IQ1) | 3.5% | 4.6% |
| Interquartile 75% (IQ3) | 5.4% | 6.7% |
| Interquartile Range (IQR) | 1.9% | 2.1% |
| Standard Deviation (Sample) | 2.3% | 5.7% |
| Standard Deviation (Population) | 2.3% | 5.6% |
Similar Demographics by Unemployment Among Ages 35 to 44 years
Demographics Similar to Immigrants from Serbia by Unemployment Among Ages 35 to 44 years
In terms of unemployment among ages 35 to 44 years, the demographic groups most similar to Immigrants from Serbia are Austrian (4.4%, a difference of 0.020%), Croatian (4.4%, a difference of 0.030%), Immigrants from Bulgaria (4.4%, a difference of 0.030%), Taiwanese (4.4%, a difference of 0.040%), and Cambodian (4.4%, a difference of 0.040%).
| Demographics | Rating | Rank | Unemployment Among Ages 35 to 44 years |
| Immigrants | Hong Kong | 97.2 /100 | #57 | Exceptional 4.4% |
| English | 97.2 /100 | #58 | Exceptional 4.4% |
| Greeks | 97.1 /100 | #59 | Exceptional 4.4% |
| Taiwanese | 97.1 /100 | #60 | Exceptional 4.4% |
| Croatians | 97.1 /100 | #61 | Exceptional 4.4% |
| Immigrants | Bulgaria | 97.1 /100 | #62 | Exceptional 4.4% |
| Austrians | 97.1 /100 | #63 | Exceptional 4.4% |
| Immigrants | Serbia | 97.0 /100 | #64 | Exceptional 4.4% |
| Cambodians | 97.0 /100 | #65 | Exceptional 4.4% |
| Icelanders | 96.8 /100 | #66 | Exceptional 4.4% |
| Argentineans | 96.8 /100 | #67 | Exceptional 4.4% |
| Immigrants | Ireland | 96.8 /100 | #68 | Exceptional 4.4% |
| Slovenes | 96.7 /100 | #69 | Exceptional 4.4% |
| Immigrants | China | 96.7 /100 | #70 | Exceptional 4.4% |
| Immigrants | Lithuania | 96.7 /100 | #71 | Exceptional 4.4% |
Demographics Similar to Immigrants from Africa by Unemployment Among Ages 35 to 44 years
In terms of unemployment among ages 35 to 44 years, the demographic groups most similar to Immigrants from Africa are Immigrants (4.9%, a difference of 0.060%), Osage (4.9%, a difference of 0.080%), Fijian (4.9%, a difference of 0.10%), Nonimmigrants (4.9%, a difference of 0.26%), and American (4.9%, a difference of 0.53%).
| Demographics | Rating | Rank | Unemployment Among Ages 35 to 44 years |
| Immigrants | Western Asia | 16.6 /100 | #207 | Poor 4.8% |
| French Canadians | 16.5 /100 | #208 | Poor 4.8% |
| Immigrants | Uruguay | 11.5 /100 | #209 | Poor 4.9% |
| Immigrants | Cameroon | 11.4 /100 | #210 | Poor 4.9% |
| Immigrants | Nonimmigrants | 9.4 /100 | #211 | Tragic 4.9% |
| Fijians | 8.7 /100 | #212 | Tragic 4.9% |
| Osage | 8.6 /100 | #213 | Tragic 4.9% |
| Immigrants | Africa | 8.2 /100 | #214 | Tragic 4.9% |
| Immigrants | Immigrants | 8.0 /100 | #215 | Tragic 4.9% |
| Americans | 6.2 /100 | #216 | Tragic 4.9% |
| Moroccans | 6.0 /100 | #217 | Tragic 4.9% |
| Chickasaw | 5.7 /100 | #218 | Tragic 4.9% |
| Sierra Leoneans | 4.8 /100 | #219 | Tragic 4.9% |
| Immigrants | Sierra Leone | 4.7 /100 | #220 | Tragic 4.9% |
| Bermudans | 3.9 /100 | #221 | Tragic 5.0% |