Immigrants from Senegal vs Swiss Unemployment Among Seniors over 75 years
COMPARE
Immigrants from Senegal
Swiss
Unemployment Among Seniors over 75 years
Unemployment Among Seniors over 75 years Comparison
Immigrants from Senegal
Swiss
9.6%
UNEMPLOYMENT AMONG SENIORS OVER 75 YEARS
0.1/ 100
METRIC RATING
278th/ 347
METRIC RANK
9.5%
UNEMPLOYMENT AMONG SENIORS OVER 75 YEARS
0.1/ 100
METRIC RATING
277th/ 347
METRIC RANK
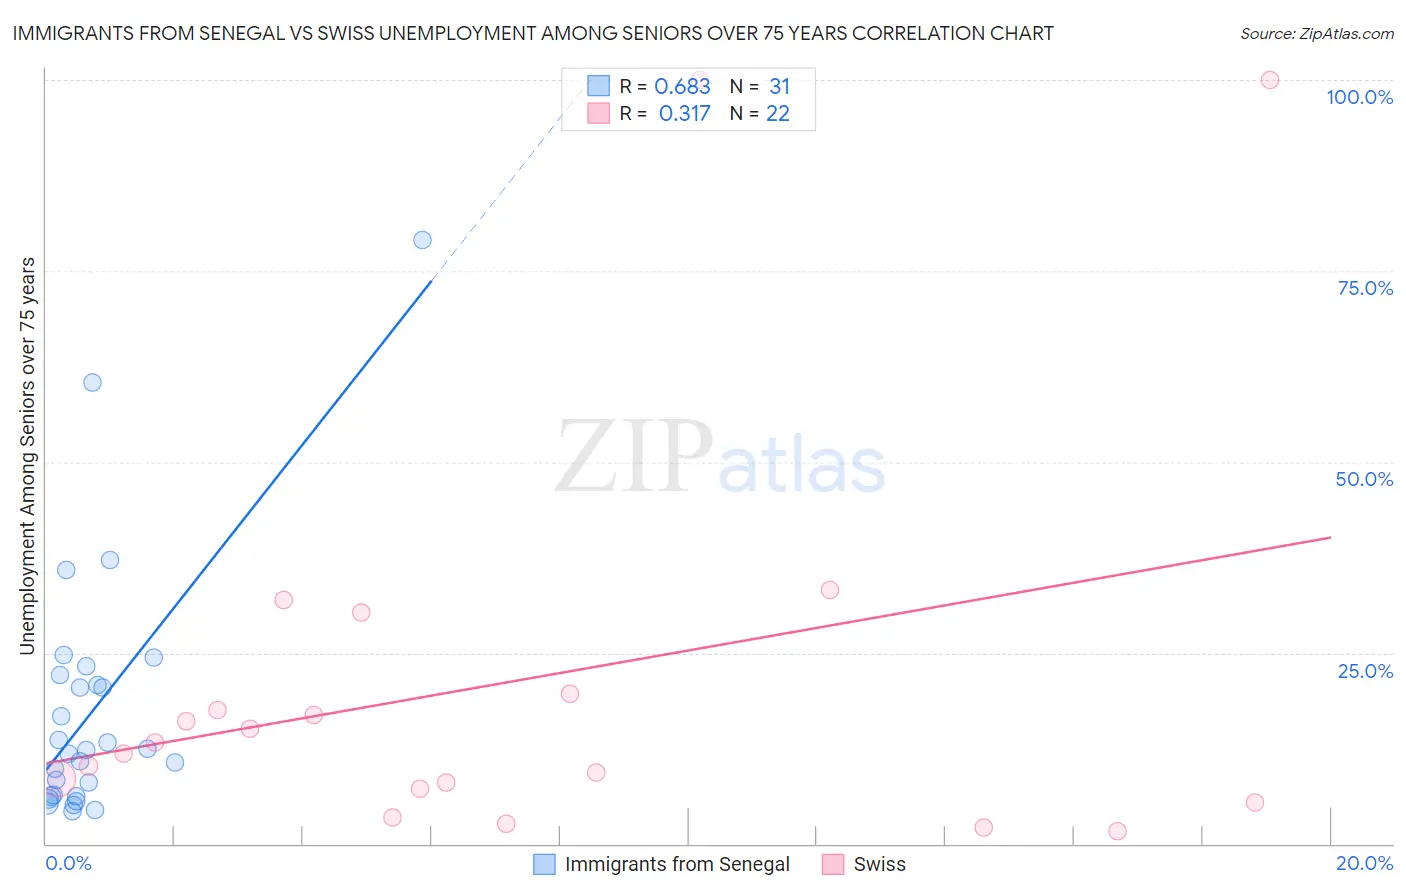
Immigrants from Senegal vs Swiss Unemployment Among Seniors over 75 years Correlation Chart
The statistical analysis conducted on geographies consisting of 69,461,037 people shows a significant positive correlation between the proportion of Immigrants from Senegal and unemployment rate among seniors over the age of 75 in the United States with a correlation coefficient (R) of 0.683 and weighted average of 9.6%. Similarly, the statistical analysis conducted on geographies consisting of 214,236,672 people shows a mild positive correlation between the proportion of Swiss and unemployment rate among seniors over the age of 75 in the United States with a correlation coefficient (R) of 0.317 and weighted average of 9.5%, a difference of 0.33%.
Unemployment Among Seniors over 75 years Correlation Summary
| Measurement | Immigrants from Senegal | Swiss |
| Minimum | 4.3% | 1.7% |
| Maximum | 79.1% | 100.0% |
| Range | 74.8% | 98.3% |
| Mean | 17.6% | 21.1% |
| Median | 12.3% | 12.5% |
| Interquartile 25% (IQ1) | 6.2% | 7.2% |
| Interquartile 75% (IQ3) | 22.1% | 19.7% |
| Interquartile Range (IQR) | 15.9% | 12.4% |
| Standard Deviation (Sample) | 16.6% | 27.1% |
| Standard Deviation (Population) | 16.3% | 26.5% |
Demographics Similar to Immigrants from Senegal and Swiss by Unemployment Among Seniors over 75 years
In terms of unemployment among seniors over 75 years, the demographic groups most similar to Immigrants from Senegal are British (9.6%, a difference of 0.15%), Croatian (9.6%, a difference of 0.29%), Bangladeshi (9.6%, a difference of 0.45%), Macedonian (9.6%, a difference of 0.79%), and Arab (9.5%, a difference of 0.83%). Similarly, the demographic groups most similar to Swiss are British (9.6%, a difference of 0.48%), Arab (9.5%, a difference of 0.50%), Senegalese (9.5%, a difference of 0.58%), Croatian (9.6%, a difference of 0.62%), and Bangladeshi (9.6%, a difference of 0.78%).
| Demographics | Rating | Rank | Unemployment Among Seniors over 75 years |
| Immigrants | Mexico | 0.4 /100 | #267 | Tragic 9.4% |
| Greeks | 0.4 /100 | #268 | Tragic 9.4% |
| Puerto Ricans | 0.3 /100 | #269 | Tragic 9.4% |
| Yaqui | 0.3 /100 | #270 | Tragic 9.4% |
| Bulgarians | 0.3 /100 | #271 | Tragic 9.4% |
| Immigrants | Iraq | 0.3 /100 | #272 | Tragic 9.4% |
| Czechoslovakians | 0.3 /100 | #273 | Tragic 9.4% |
| Jamaicans | 0.2 /100 | #274 | Tragic 9.5% |
| Senegalese | 0.2 /100 | #275 | Tragic 9.5% |
| Arabs | 0.2 /100 | #276 | Tragic 9.5% |
| Swiss | 0.1 /100 | #277 | Tragic 9.5% |
| Immigrants | Senegal | 0.1 /100 | #278 | Tragic 9.6% |
| British | 0.1 /100 | #279 | Tragic 9.6% |
| Croatians | 0.1 /100 | #280 | Tragic 9.6% |
| Bangladeshis | 0.1 /100 | #281 | Tragic 9.6% |
| Macedonians | 0.0 /100 | #282 | Tragic 9.6% |
| Immigrants | Nigeria | 0.0 /100 | #283 | Tragic 9.6% |
| Europeans | 0.0 /100 | #284 | Tragic 9.7% |
| Carpatho Rusyns | 0.0 /100 | #285 | Tragic 9.7% |
| Nigerians | 0.0 /100 | #286 | Tragic 9.7% |
| Danes | 0.0 /100 | #287 | Tragic 9.7% |