Immigrants from Senegal vs Immigrants from Sri Lanka Unemployment Among Ages 25 to 29 years
COMPARE
Immigrants from Senegal
Immigrants from Sri Lanka
Unemployment Among Ages 25 to 29 years
Unemployment Among Ages 25 to 29 years Comparison
Immigrants from Senegal
Immigrants from Sri Lanka
7.6%
UNEMPLOYMENT AMONG AGES 25 TO 29 YEARS
0.0/ 100
METRIC RATING
282nd/ 347
METRIC RANK
6.3%
UNEMPLOYMENT AMONG AGES 25 TO 29 YEARS
97.9/ 100
METRIC RATING
64th/ 347
METRIC RANK
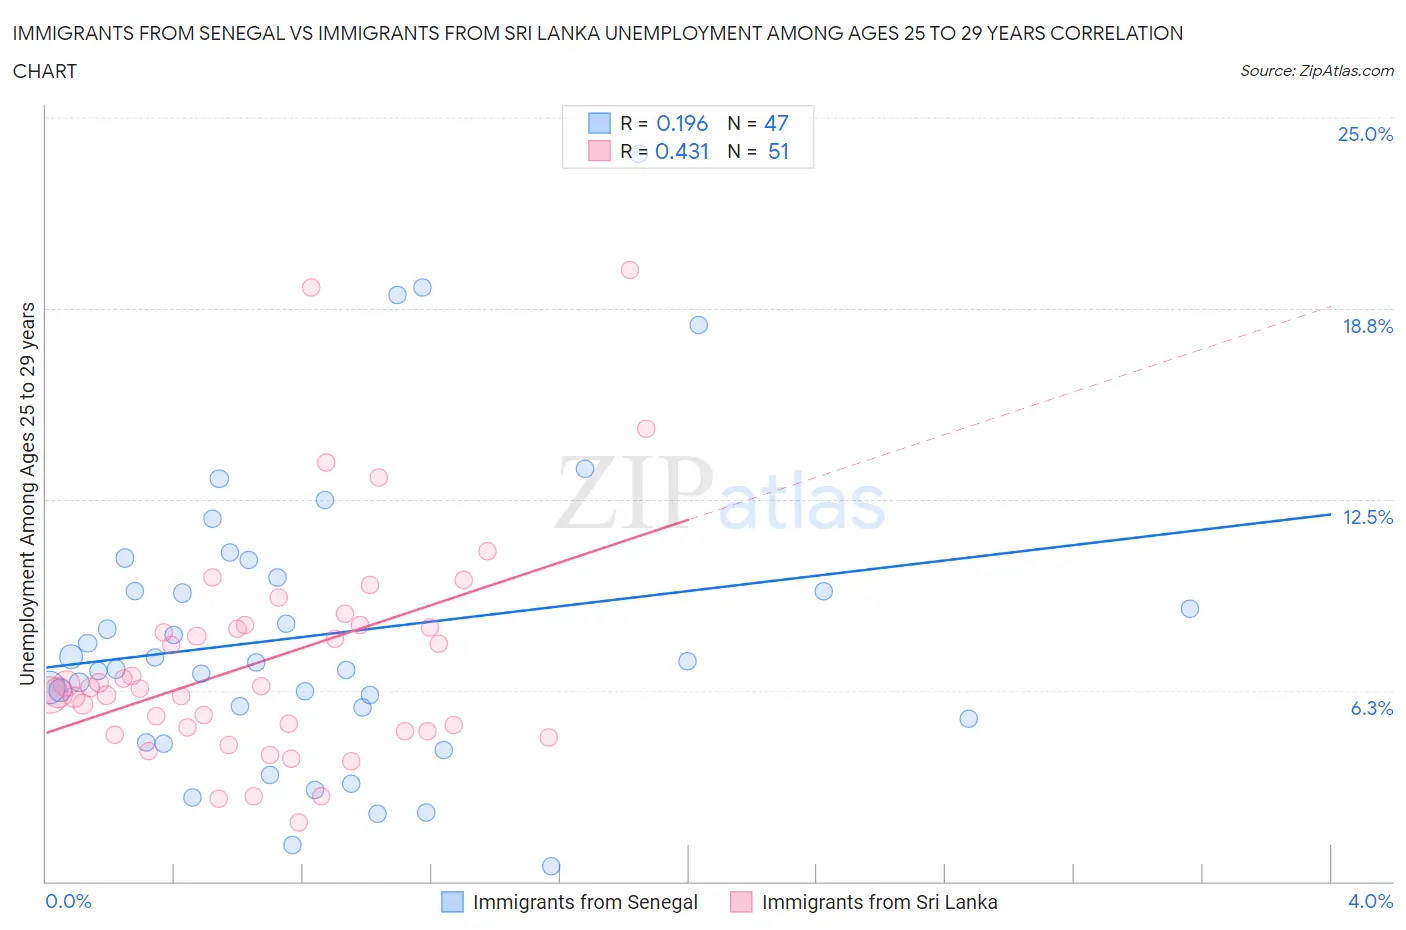
Immigrants from Senegal vs Immigrants from Sri Lanka Unemployment Among Ages 25 to 29 years Correlation Chart
The statistical analysis conducted on geographies consisting of 89,401,729 people shows a poor positive correlation between the proportion of Immigrants from Senegal and unemployment rate among population between the ages 25 and 29 in the United States with a correlation coefficient (R) of 0.196 and weighted average of 7.6%. Similarly, the statistical analysis conducted on geographies consisting of 147,259,052 people shows a moderate positive correlation between the proportion of Immigrants from Sri Lanka and unemployment rate among population between the ages 25 and 29 in the United States with a correlation coefficient (R) of 0.431 and weighted average of 6.3%, a difference of 20.9%.
Unemployment Among Ages 25 to 29 years Correlation Summary
| Measurement | Immigrants from Senegal | Immigrants from Sri Lanka |
| Minimum | 0.50% | 1.9% |
| Maximum | 23.8% | 20.0% |
| Range | 23.3% | 18.1% |
| Mean | 8.1% | 7.3% |
| Median | 7.1% | 6.3% |
| Interquartile 25% (IQ1) | 5.3% | 4.9% |
| Interquartile 75% (IQ3) | 9.9% | 8.4% |
| Interquartile Range (IQR) | 4.6% | 3.5% |
| Standard Deviation (Sample) | 4.8% | 3.7% |
| Standard Deviation (Population) | 4.8% | 3.7% |
Similar Demographics by Unemployment Among Ages 25 to 29 years
Demographics Similar to Immigrants from Senegal by Unemployment Among Ages 25 to 29 years
In terms of unemployment among ages 25 to 29 years, the demographic groups most similar to Immigrants from Senegal are Immigrants from Bangladesh (7.5%, a difference of 0.17%), Creek (7.6%, a difference of 0.17%), Cherokee (7.6%, a difference of 0.18%), Immigrants from Caribbean (7.5%, a difference of 0.26%), and Senegalese (7.6%, a difference of 0.30%).
| Demographics | Rating | Rank | Unemployment Among Ages 25 to 29 years |
| Immigrants | Ghana | 0.0 /100 | #275 | Tragic 7.5% |
| French American Indians | 0.0 /100 | #276 | Tragic 7.5% |
| Iroquois | 0.0 /100 | #277 | Tragic 7.5% |
| Mexicans | 0.0 /100 | #278 | Tragic 7.5% |
| Nepalese | 0.0 /100 | #279 | Tragic 7.5% |
| Immigrants | Caribbean | 0.0 /100 | #280 | Tragic 7.5% |
| Immigrants | Bangladesh | 0.0 /100 | #281 | Tragic 7.5% |
| Immigrants | Senegal | 0.0 /100 | #282 | Tragic 7.6% |
| Creek | 0.0 /100 | #283 | Tragic 7.6% |
| Cherokee | 0.0 /100 | #284 | Tragic 7.6% |
| Senegalese | 0.0 /100 | #285 | Tragic 7.6% |
| Vietnamese | 0.0 /100 | #286 | Tragic 7.6% |
| Immigrants | Mexico | 0.0 /100 | #287 | Tragic 7.6% |
| Africans | 0.0 /100 | #288 | Tragic 7.6% |
| Belizeans | 0.0 /100 | #289 | Tragic 7.7% |
Demographics Similar to Immigrants from Sri Lanka by Unemployment Among Ages 25 to 29 years
In terms of unemployment among ages 25 to 29 years, the demographic groups most similar to Immigrants from Sri Lanka are Kenyan (6.3%, a difference of 0.050%), Immigrants from Lebanon (6.3%, a difference of 0.060%), Indian (Asian) (6.3%, a difference of 0.070%), Immigrants from Northern Africa (6.3%, a difference of 0.080%), and Immigrants from China (6.2%, a difference of 0.12%).
| Demographics | Rating | Rank | Unemployment Among Ages 25 to 29 years |
| Immigrants | Saudi Arabia | 98.6 /100 | #57 | Exceptional 6.2% |
| Immigrants | Eastern Asia | 98.4 /100 | #58 | Exceptional 6.2% |
| Luxembourgers | 98.3 /100 | #59 | Exceptional 6.2% |
| Immigrants | Taiwan | 98.3 /100 | #60 | Exceptional 6.2% |
| Bhutanese | 98.2 /100 | #61 | Exceptional 6.2% |
| Immigrants | China | 98.1 /100 | #62 | Exceptional 6.2% |
| Kenyans | 98.0 /100 | #63 | Exceptional 6.3% |
| Immigrants | Sri Lanka | 97.9 /100 | #64 | Exceptional 6.3% |
| Immigrants | Lebanon | 97.8 /100 | #65 | Exceptional 6.3% |
| Indians (Asian) | 97.8 /100 | #66 | Exceptional 6.3% |
| Immigrants | Northern Africa | 97.8 /100 | #67 | Exceptional 6.3% |
| Palestinians | 97.7 /100 | #68 | Exceptional 6.3% |
| Immigrants | Hong Kong | 97.5 /100 | #69 | Exceptional 6.3% |
| Immigrants | Malaysia | 97.5 /100 | #70 | Exceptional 6.3% |
| Immigrants | France | 97.4 /100 | #71 | Exceptional 6.3% |