Immigrants from Senegal vs Immigrants from China Unemployment Among Ages 30 to 34 years
COMPARE
Immigrants from Senegal
Immigrants from China
Unemployment Among Ages 30 to 34 years
Unemployment Among Ages 30 to 34 years Comparison
Immigrants from Senegal
Immigrants from China
6.3%
UNEMPLOYMENT AMONG AGES 30 TO 34 YEARS
0.0/ 100
METRIC RATING
270th/ 347
METRIC RANK
5.1%
UNEMPLOYMENT AMONG AGES 30 TO 34 YEARS
97.2/ 100
METRIC RATING
57th/ 347
METRIC RANK
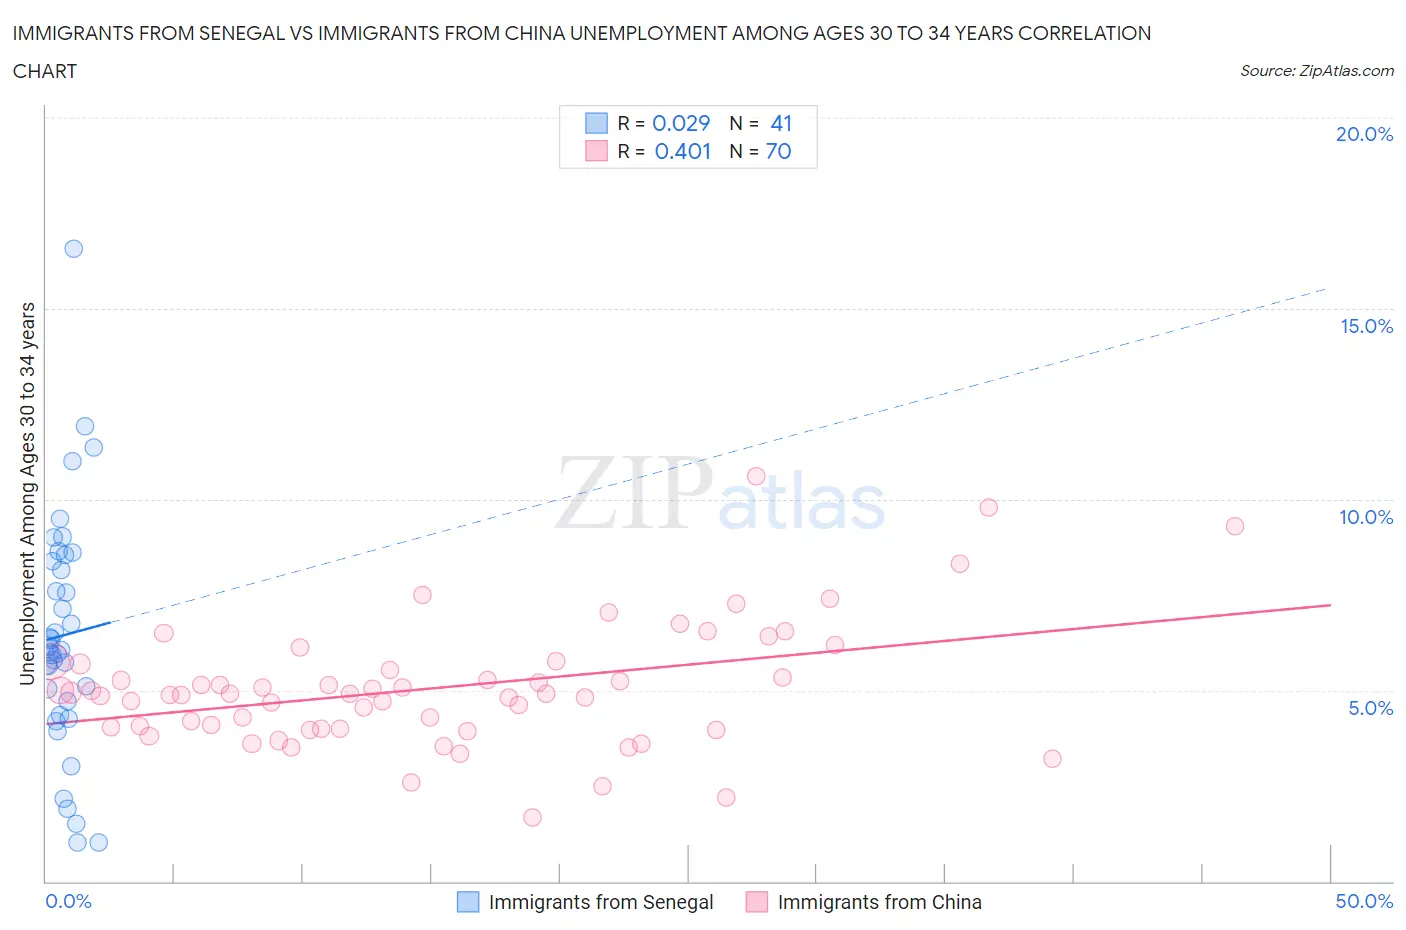
Immigrants from Senegal vs Immigrants from China Unemployment Among Ages 30 to 34 years Correlation Chart
The statistical analysis conducted on geographies consisting of 89,001,618 people shows no correlation between the proportion of Immigrants from Senegal and unemployment rate among population between the ages 30 and 34 in the United States with a correlation coefficient (R) of 0.029 and weighted average of 6.3%. Similarly, the statistical analysis conducted on geographies consisting of 425,221,319 people shows a moderate positive correlation between the proportion of Immigrants from China and unemployment rate among population between the ages 30 and 34 in the United States with a correlation coefficient (R) of 0.401 and weighted average of 5.1%, a difference of 22.1%.
Unemployment Among Ages 30 to 34 years Correlation Summary
| Measurement | Immigrants from Senegal | Immigrants from China |
| Minimum | 1.0% | 1.7% |
| Maximum | 16.5% | 10.6% |
| Range | 15.5% | 8.9% |
| Mean | 6.4% | 5.1% |
| Median | 6.0% | 4.9% |
| Interquartile 25% (IQ1) | 4.5% | 4.0% |
| Interquartile 75% (IQ3) | 8.5% | 5.7% |
| Interquartile Range (IQR) | 3.9% | 1.7% |
| Standard Deviation (Sample) | 3.1% | 1.6% |
| Standard Deviation (Population) | 3.1% | 1.6% |
Similar Demographics by Unemployment Among Ages 30 to 34 years
Demographics Similar to Immigrants from Senegal by Unemployment Among Ages 30 to 34 years
In terms of unemployment among ages 30 to 34 years, the demographic groups most similar to Immigrants from Senegal are French American Indian (6.3%, a difference of 0.010%), Comanche (6.3%, a difference of 0.19%), Blackfeet (6.3%, a difference of 0.30%), Immigrants from Haiti (6.2%, a difference of 0.31%), and Ottawa (6.3%, a difference of 0.32%).
| Demographics | Rating | Rank | Unemployment Among Ages 30 to 34 years |
| Spanish Americans | 0.0 /100 | #263 | Tragic 6.2% |
| Chickasaw | 0.0 /100 | #264 | Tragic 6.2% |
| Americans | 0.0 /100 | #265 | Tragic 6.2% |
| Seminole | 0.0 /100 | #266 | Tragic 6.2% |
| Immigrants | Mexico | 0.0 /100 | #267 | Tragic 6.2% |
| Immigrants | Haiti | 0.0 /100 | #268 | Tragic 6.2% |
| French American Indians | 0.0 /100 | #269 | Tragic 6.3% |
| Immigrants | Senegal | 0.0 /100 | #270 | Tragic 6.3% |
| Comanche | 0.0 /100 | #271 | Tragic 6.3% |
| Blackfeet | 0.0 /100 | #272 | Tragic 6.3% |
| Ottawa | 0.0 /100 | #273 | Tragic 6.3% |
| U.S. Virgin Islanders | 0.0 /100 | #274 | Tragic 6.3% |
| Ecuadorians | 0.0 /100 | #275 | Tragic 6.3% |
| Pennsylvania Germans | 0.0 /100 | #276 | Tragic 6.3% |
| Immigrants | Ecuador | 0.0 /100 | #277 | Tragic 6.3% |
Demographics Similar to Immigrants from China by Unemployment Among Ages 30 to 34 years
In terms of unemployment among ages 30 to 34 years, the demographic groups most similar to Immigrants from China are Asian (5.1%, a difference of 0.0%), Swedish (5.1%, a difference of 0.090%), Immigrants from Somalia (5.1%, a difference of 0.10%), Indian (Asian) (5.1%, a difference of 0.12%), and Immigrants from France (5.1%, a difference of 0.14%).
| Demographics | Rating | Rank | Unemployment Among Ages 30 to 34 years |
| Puget Sound Salish | 98.2 /100 | #50 | Exceptional 5.1% |
| Turks | 98.2 /100 | #51 | Exceptional 5.1% |
| Immigrants | Burma/Myanmar | 98.1 /100 | #52 | Exceptional 5.1% |
| Cubans | 98.1 /100 | #53 | Exceptional 5.1% |
| Immigrants | Morocco | 97.9 /100 | #54 | Exceptional 5.1% |
| Chinese | 97.7 /100 | #55 | Exceptional 5.1% |
| Immigrants | Serbia | 97.4 /100 | #56 | Exceptional 5.1% |
| Immigrants | China | 97.2 /100 | #57 | Exceptional 5.1% |
| Asians | 97.2 /100 | #58 | Exceptional 5.1% |
| Swedes | 97.1 /100 | #59 | Exceptional 5.1% |
| Immigrants | Somalia | 97.1 /100 | #60 | Exceptional 5.1% |
| Indians (Asian) | 97.0 /100 | #61 | Exceptional 5.1% |
| Immigrants | France | 97.0 /100 | #62 | Exceptional 5.1% |
| Belgians | 97.0 /100 | #63 | Exceptional 5.1% |
| Immigrants | Eastern Asia | 96.9 /100 | #64 | Exceptional 5.1% |