Immigrants from Scotland vs Danish Male Unemployment
COMPARE
Immigrants from Scotland
Danish
Male Unemployment
Male Unemployment Comparison
Immigrants from Scotland
Danes
4.9%
MALE UNEMPLOYMENT
98.9/ 100
METRIC RATING
48th/ 347
METRIC RANK
4.5%
MALE UNEMPLOYMENT
100.0/ 100
METRIC RATING
5th/ 347
METRIC RANK
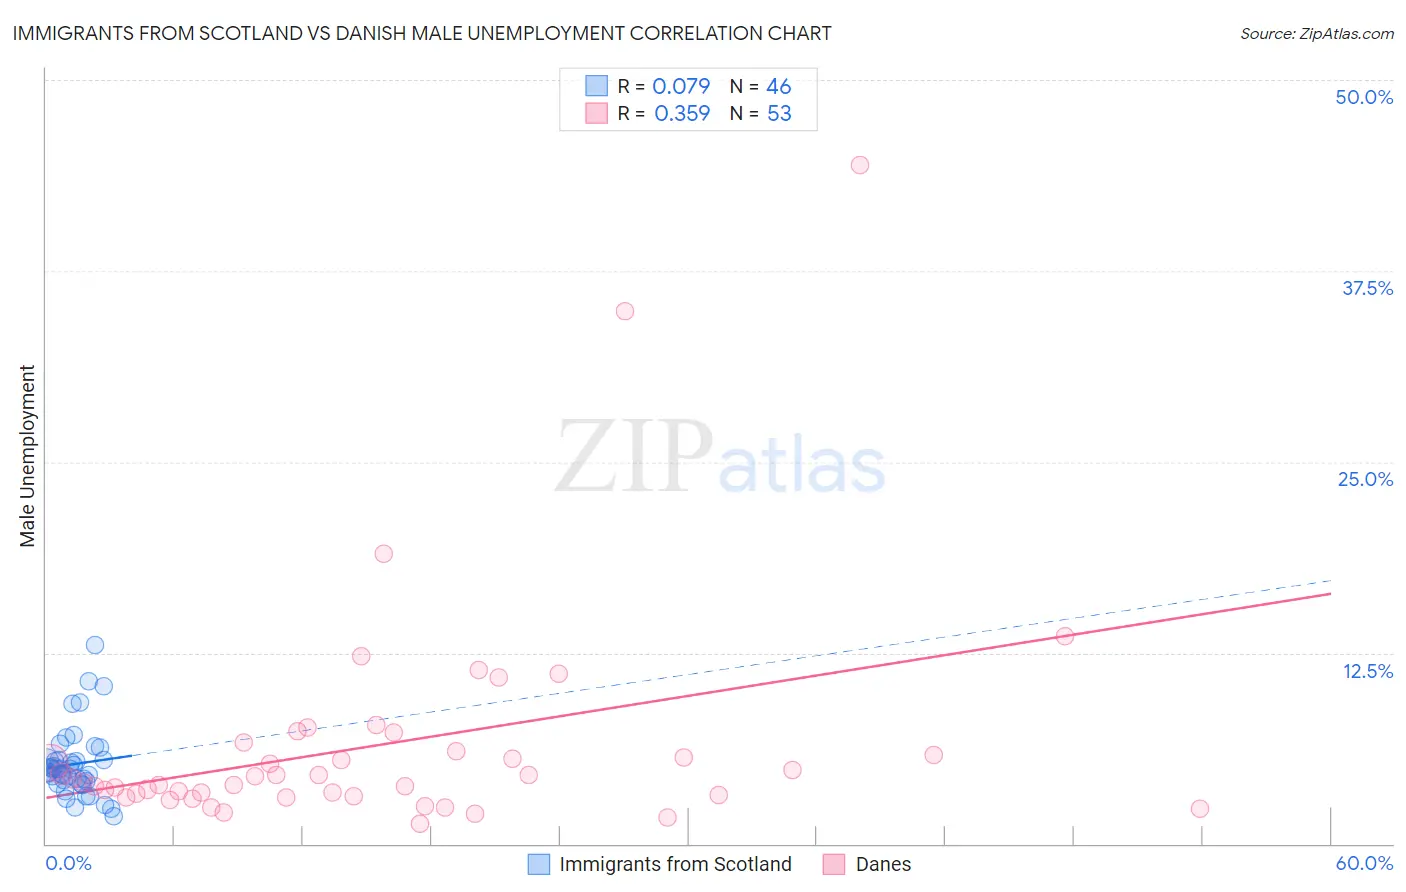
Immigrants from Scotland vs Danish Male Unemployment Correlation Chart
The statistical analysis conducted on geographies consisting of 195,967,214 people shows a slight positive correlation between the proportion of Immigrants from Scotland and unemployment rate among males in the United States with a correlation coefficient (R) of 0.079 and weighted average of 4.9%. Similarly, the statistical analysis conducted on geographies consisting of 469,242,434 people shows a mild positive correlation between the proportion of Danes and unemployment rate among males in the United States with a correlation coefficient (R) of 0.359 and weighted average of 4.5%, a difference of 10.1%.
Male Unemployment Correlation Summary
| Measurement | Immigrants from Scotland | Danish |
| Minimum | 1.8% | 1.3% |
| Maximum | 13.0% | 44.4% |
| Range | 11.2% | 43.1% |
| Mean | 5.2% | 6.5% |
| Median | 4.9% | 4.3% |
| Interquartile 25% (IQ1) | 4.1% | 3.1% |
| Interquartile 75% (IQ3) | 5.5% | 6.3% |
| Interquartile Range (IQR) | 1.4% | 3.2% |
| Standard Deviation (Sample) | 2.2% | 7.5% |
| Standard Deviation (Population) | 2.2% | 7.4% |
Similar Demographics by Male Unemployment
Demographics Similar to Immigrants from Scotland by Male Unemployment
In terms of male unemployment, the demographic groups most similar to Immigrants from Scotland are Polish (4.9%, a difference of 0.010%), Austrian (4.9%, a difference of 0.020%), Croatian (4.9%, a difference of 0.020%), Slovene (5.0%, a difference of 0.060%), and Irish (5.0%, a difference of 0.080%).
| Demographics | Rating | Rank | Male Unemployment |
| Chinese | 99.3 /100 | #41 | Exceptional 4.9% |
| Immigrants | Belgium | 99.2 /100 | #42 | Exceptional 4.9% |
| Immigrants | Japan | 99.2 /100 | #43 | Exceptional 4.9% |
| Immigrants | Korea | 99.1 /100 | #44 | Exceptional 4.9% |
| Immigrants | Zimbabwe | 99.0 /100 | #45 | Exceptional 4.9% |
| Bhutanese | 98.9 /100 | #46 | Exceptional 4.9% |
| Austrians | 98.9 /100 | #47 | Exceptional 4.9% |
| Immigrants | Scotland | 98.9 /100 | #48 | Exceptional 4.9% |
| Poles | 98.9 /100 | #49 | Exceptional 4.9% |
| Croatians | 98.9 /100 | #50 | Exceptional 4.9% |
| Slovenes | 98.8 /100 | #51 | Exceptional 5.0% |
| Irish | 98.8 /100 | #52 | Exceptional 5.0% |
| Jordanians | 98.8 /100 | #53 | Exceptional 5.0% |
| Yugoslavians | 98.7 /100 | #54 | Exceptional 5.0% |
| Czechoslovakians | 98.7 /100 | #55 | Exceptional 5.0% |
Demographics Similar to Danes by Male Unemployment
In terms of male unemployment, the demographic groups most similar to Danes are Venezuelan (4.5%, a difference of 0.45%), Czech (4.5%, a difference of 0.65%), Luxembourger (4.5%, a difference of 0.91%), Immigrants from Venezuela (4.4%, a difference of 1.0%), and Norwegian (4.4%, a difference of 1.4%).
| Demographics | Rating | Rank | Male Unemployment |
| Immigrants | India | 100.0 /100 | #1 | Exceptional 4.4% |
| Immigrants | Cuba | 100.0 /100 | #2 | Exceptional 4.4% |
| Norwegians | 100.0 /100 | #3 | Exceptional 4.4% |
| Immigrants | Venezuela | 100.0 /100 | #4 | Exceptional 4.4% |
| Danes | 100.0 /100 | #5 | Exceptional 4.5% |
| Venezuelans | 100.0 /100 | #6 | Exceptional 4.5% |
| Czechs | 100.0 /100 | #7 | Exceptional 4.5% |
| Luxembourgers | 100.0 /100 | #8 | Exceptional 4.5% |
| Thais | 100.0 /100 | #9 | Exceptional 4.6% |
| Cubans | 100.0 /100 | #10 | Exceptional 4.6% |
| Swedes | 100.0 /100 | #11 | Exceptional 4.6% |
| Immigrants | Bolivia | 100.0 /100 | #12 | Exceptional 4.7% |
| Bolivians | 100.0 /100 | #13 | Exceptional 4.7% |
| Germans | 100.0 /100 | #14 | Exceptional 4.7% |
| Scandinavians | 100.0 /100 | #15 | Exceptional 4.7% |