Immigrants from Scotland vs Cape Verdean Unemployment Among Ages 35 to 44 years

COMPARE

Immigrants from Scotland
Race
Ancestry
AfghanAfricanAlaska NativeAlaskan AthabascanAlbanianAleutAlsatianAmericanApacheArabArapahoArgentineanArmenianAssyrian/Chaldean/SyriacAustralianAustrianBahamianBangladeshiBarbadianBasqueBelgianBelizeanBermudanBhutaneseBlackfeetBolivianBrazilianBritishBritish West IndianBulgarianBurmeseCajunCambodianCanadianCarpatho RusynCelticCentral AmericanCentral American IndianCherokeeCheyenneChickasawChileanChineseChippewaChoctawColombianColvilleComancheCosta RicanCreeCreekCroatianCrowCubanCypriotCzechCzechoslovakianDanishDelawareDominicanDutchDutch West IndianEastern EuropeanEcuadorianEgyptianEnglishEstonianEthiopianEuropeanFijianFilipinoFinnishFrenchFrench American IndianFrench CanadianGermanGerman RussianGhanaianGreekGuamanian/ChamorroGuatemalanGuyaneseHaitianHmongHonduranHopiHoumaHungarianIcelanderIndian (Asian)IndonesianInupiatIranianIraqiIrishIroquoisIsraeliItalianJamaicanJapaneseJordanianKenyanKiowaKoreanLaotianLatvianLebaneseLiberianLithuanianLumbeeLuxembourgerMacedonianMalaysianMalteseMarshalleseMenomineeMexicanMexican American IndianMongolianMoroccanNative HawaiianNavajoNepaleseNew ZealanderNicaraguanNigerianNorthern EuropeanNorwegianOkinawanOsageOttawaPaiutePakistaniPalestinianPanamanianParaguayanPennsylvania GermanPeruvianPimaPolishPortuguesePotawatomiPuebloPuerto RicanPuget Sound SalishRomanianRussianSalvadoranSamoanScandinavianScotch-IrishScottishSeminoleSenegaleseSerbianShoshoneSierra LeoneanSiouxSlavicSlovakSloveneSomaliSouth AfricanSouth AmericanSouth American IndianSoviet UnionSpaniardSpanishSpanish AmericanSpanish American IndianSri LankanSubsaharan AfricanSudaneseSwedishSwissSyrianTaiwaneseThaiTlingit-HaidaTohono O'OdhamTonganTrinidadian and TobagonianTsimshianTurkishU.S. Virgin IslanderUgandanUkrainianUruguayanUteVenezuelanVietnameseWelshWest IndianYakamaYaquiYugoslavianYumanYup'ikZimbabwean
Immigration
NonimmigrantsImmigrantsAfghanistanAfricaAlbaniaArgentinaArmeniaAsiaAustraliaAustriaBahamasBangladeshBarbadosBelarusBelgiumBelizeBoliviaBosnia and HerzegovinaBrazilBulgariaBurma/MyanmarCabo VerdeCambodiaCameroonCanadaCaribbeanCentral AmericaChileChinaColombiaCongoCosta RicaCroatiaCubaCzechoslovakiaDenmarkDominicaDominican RepublicEastern AfricaEastern AsiaEastern EuropeEcuadorEgyptEl SalvadorEnglandEritreaEthiopiaEuropeFijiFranceGermanyGhanaGreeceGrenadaGuatemalaGuyanaHaitiHondurasHong KongHungaryIndiaIndonesiaIranIraqIrelandIsraelItalyJamaicaJapanJordanKazakhstanKenyaKoreaKuwaitLaosLatin AmericaLatviaLebanonLiberiaLithuaniaMalaysiaMexicoMicronesiaMiddle AfricaMoldovaMoroccoNepalNetherlandsNicaraguaNigeriaNorth AmericaNorth MacedoniaNorthern AfricaNorthern EuropeNorwayOceaniaPakistanPanamaPeruPhilippinesPolandPortugalRomaniaRussiaSaudi ArabiaScotlandSenegalSerbiaSierra LeoneSingaporeSomaliaSouth AfricaSouth AmericaSouth Central AsiaSouth Eastern AsiaSouthern EuropeSpainSri LankaSt. Vincent and the GrenadinesSudanSwedenSwitzerlandSyriaTaiwanThailandTrinidad and TobagoTurkeyUgandaUkraineUruguayUzbekistanVenezuelaVietnamWest IndiesWestern AfricaWestern AsiaWestern EuropeYemenZaireZimbabweAzores
Cape Verdean
Race
Ancestry
AfghanAfricanAlaska NativeAlaskan AthabascanAlbanianAleutAlsatianAmericanApacheArabArapahoArgentineanArmenianAssyrian/Chaldean/SyriacAustralianAustrianBahamianBangladeshiBarbadianBasqueBelgianBelizeanBermudanBhutaneseBlackfeetBolivianBrazilianBritishBritish West IndianBulgarianBurmeseCajunCambodianCanadianCape VerdeanCarpatho RusynCelticCentral AmericanCentral American IndianCherokeeCheyenneChickasawChileanChineseChippewaChoctawColombianColvilleComancheCosta RicanCreeCreekCroatianCrowCubanCypriotCzechCzechoslovakianDanishDelawareDominicanDutchDutch West IndianEastern EuropeanEcuadorianEgyptianEnglishEstonianEthiopianEuropeanFijianFilipinoFinnishFrenchFrench American IndianFrench CanadianGermanGerman RussianGhanaianGreekGuamanian/ChamorroGuatemalanGuyaneseHaitianHmongHonduranHopiHoumaHungarianIcelanderIndian (Asian)IndonesianInupiatIranianIraqiIrishIroquoisIsraeliItalianJamaicanJapaneseJordanianKenyanKiowaKoreanLaotianLatvianLebaneseLiberianLithuanianLumbeeLuxembourgerMacedonianMalaysianMalteseMarshalleseMenomineeMexicanMexican American IndianMongolianMoroccanNative HawaiianNavajoNepaleseNew ZealanderNicaraguanNigerianNorthern EuropeanNorwegianOkinawanOsageOttawaPaiutePakistaniPalestinianPanamanianParaguayanPennsylvania GermanPeruvianPimaPolishPortuguesePotawatomiPuebloPuerto RicanPuget Sound SalishRomanianRussianSalvadoranSamoanScandinavianScotch-IrishScottishSeminoleSenegaleseSerbianShoshoneSierra LeoneanSiouxSlavicSlovakSloveneSomaliSouth AfricanSouth AmericanSouth American IndianSoviet UnionSpaniardSpanishSpanish AmericanSpanish American IndianSri LankanSubsaharan AfricanSudaneseSwedishSwissSyrianTaiwaneseThaiTlingit-HaidaTohono O'OdhamTonganTrinidadian and TobagonianTsimshianTurkishU.S. Virgin IslanderUgandanUkrainianUruguayanUteVenezuelanVietnameseWelshWest IndianYakamaYaquiYugoslavianYumanYup'ikZimbabwean
Immigration
NonimmigrantsImmigrantsAfghanistanAfricaAlbaniaArgentinaArmeniaAsiaAustraliaAustriaBahamasBangladeshBarbadosBelarusBelgiumBelizeBoliviaBosnia and HerzegovinaBrazilBulgariaBurma/MyanmarCabo VerdeCambodiaCameroonCanadaCaribbeanCentral AmericaChileChinaColombiaCongoCosta RicaCroatiaCubaCzechoslovakiaDenmarkDominicaDominican RepublicEastern AfricaEastern AsiaEastern EuropeEcuadorEgyptEl SalvadorEnglandEritreaEthiopiaEuropeFijiFranceGermanyGhanaGreeceGrenadaGuatemalaGuyanaHaitiHondurasHong KongHungaryIndiaIndonesiaIranIraqIrelandIsraelItalyJamaicaJapanJordanKazakhstanKenyaKoreaKuwaitLaosLatin AmericaLatviaLebanonLiberiaLithuaniaMalaysiaMexicoMicronesiaMiddle AfricaMoldovaMoroccoNepalNetherlandsNicaraguaNigeriaNorth AmericaNorth MacedoniaNorthern AfricaNorthern EuropeNorwayOceaniaPakistanPanamaPeruPhilippinesPolandPortugalRomaniaRussiaSaudi ArabiaSenegalSerbiaSierra LeoneSingaporeSomaliaSouth AfricaSouth AmericaSouth Central AsiaSouth Eastern AsiaSouthern EuropeSpainSri LankaSt. Vincent and the GrenadinesSudanSwedenSwitzerlandSyriaTaiwanThailandTrinidad and TobagoTurkeyUgandaUkraineUruguayUzbekistanVenezuelaVietnamWest IndiesWestern AfricaWestern AsiaWestern EuropeYemenZaireZimbabweAzores
Unemployment Among Ages 35 to 44 years
Income
Poverty
Unemployment
Labor Participation
Family Structure
Vehicle Availability
Education Level
Disability

Unemployment Among Ages 35 to 44 years Comparison

Immigrants from Scotland

Cape Verdeans

Exceptional
Tragic
4.4%
UNEMPLOYMENT AMONG AGES 35 TO 44 YEARS
95.6/ 100
METRIC RATING
81st/ 347
METRIC RANK
6.6%
UNEMPLOYMENT AMONG AGES 35 TO 44 YEARS
0.0/ 100
METRIC RATING
327th/ 347
METRIC RANK

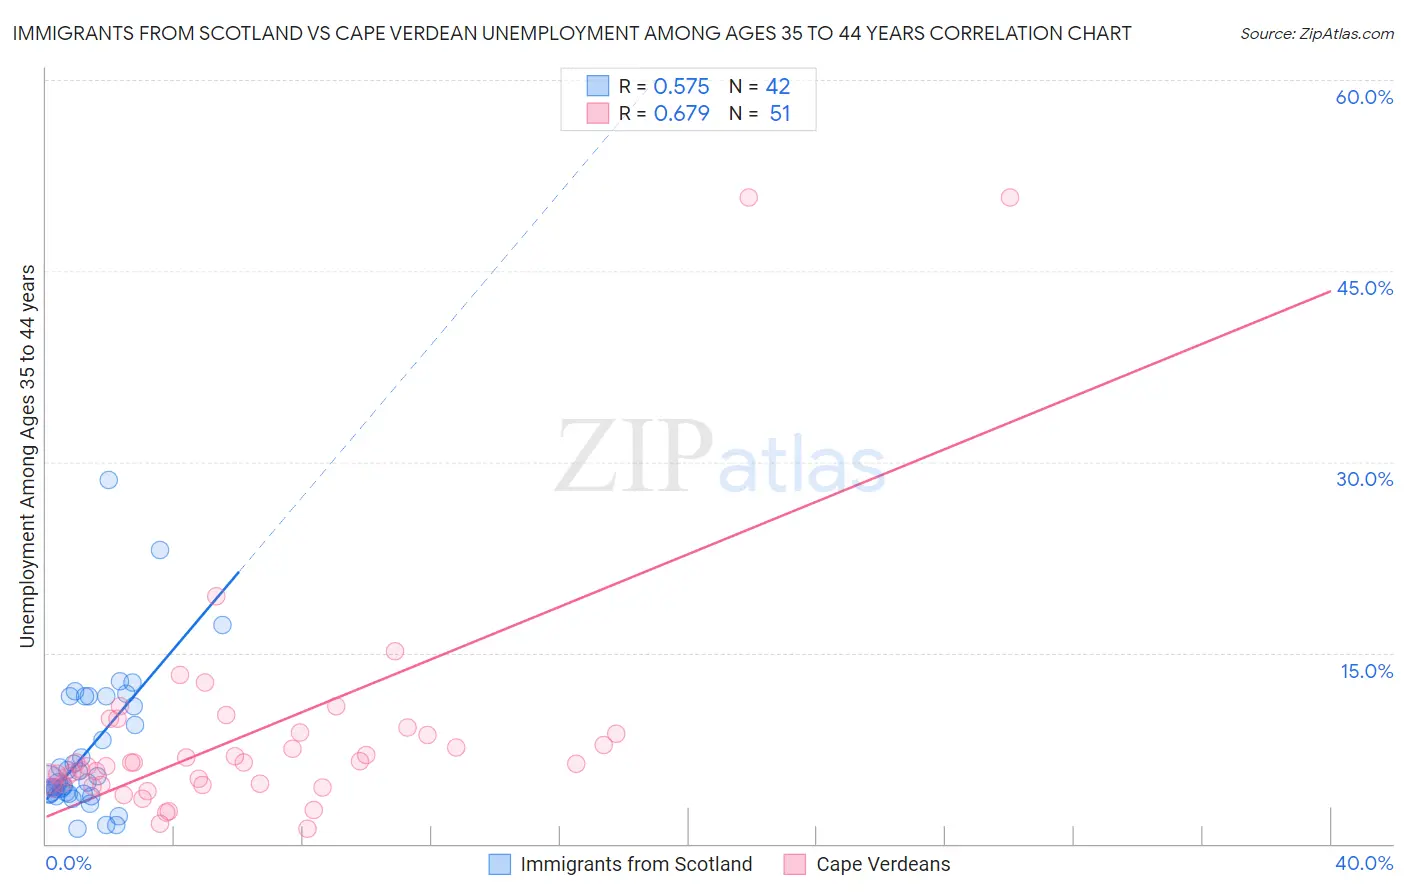
Immigrants from Scotland vs Cape Verdean Unemployment Among Ages 35 to 44 years Correlation Chart

The statistical analysis conducted on geographies consisting of 193,761,745 people shows a substantial positive correlation between the proportion of Immigrants from Scotland and unemployment rate among population between the ages 35 and 44 in the United States with a correlation coefficient (R) of 0.575 and weighted average of 4.4%. Similarly, the statistical analysis conducted on geographies consisting of 106,781,435 people shows a significant positive correlation between the proportion of Cape Verdeans and unemployment rate among population between the ages 35 and 44 in the United States with a correlation coefficient (R) of 0.679 and weighted average of 6.6%, a difference of 48.0%.
Immigrants from Scotland vs Cape Verdean Unemployment Among Ages 35 to 44 years

Unemployment Among Ages 35 to 44 years Correlation Summary

MeasurementImmigrants from ScotlandCape Verdean
Minimum1.1%1.2%
Maximum28.6%50.8%
Range27.5%49.6%
Mean7.4%8.5%
Median4.8%6.4%
Interquartile 25% (IQ1)4.0%4.6%
Interquartile 75% (IQ3)11.5%8.7%
Interquartile Range (IQR)7.6%4.1%
Standard Deviation (Sample)5.7%9.3%
Standard Deviation (Population)5.6%9.2%

Similar Demographics by Unemployment Among Ages 35 to 44 years

Demographics Similar to Immigrants from Scotland by Unemployment Among Ages 35 to 44 years

In terms of unemployment among ages 35 to 44 years, the demographic groups most similar to Immigrants from Scotland are Immigrants from Asia (4.4%, a difference of 0.010%), Kenyan (4.4%, a difference of 0.050%), Immigrants from Sweden (4.4%, a difference of 0.12%), Immigrants from Australia (4.4%, a difference of 0.14%), and Indian (Asian) (4.4%, a difference of 0.17%).
DemographicsRating | RankUnemployment Among Ages 35 to 44 years
Poles
96.4
/100
|
#74
Exceptional
4.4%
Immigrants | Romania
96.3
/100
|
#75
Exceptional
4.4%
Immigrants | Jordan
96.3
/100
|
#76
Exceptional
4.4%
Dutch
96.1
/100
|
#77
Exceptional
4.4%
Indians (Asian)
96.0
/100
|
#78
Exceptional
4.4%
Immigrants | Sweden
95.9
/100
|
#79
Exceptional
4.4%
Kenyans
95.7
/100
|
#80
Exceptional
4.4%
Immigrants | Scotland
95.6
/100
|
#81
Exceptional
4.4%
Immigrants | Asia
95.6
/100
|
#82
Exceptional
4.4%
Immigrants | Australia
95.3
/100
|
#83
Exceptional
4.4%
Immigrants | Chile
95.2
/100
|
#84
Exceptional
4.4%
Immigrants | Kenya
95.0
/100
|
#85
Exceptional
4.4%
Serbians
94.9
/100
|
#86
Exceptional
4.4%
Immigrants | Bosnia and Herzegovina
94.8
/100
|
#87
Exceptional
4.4%
Immigrants | Latvia
94.8
/100
|
#88
Exceptional
4.4%

Demographics Similar to Cape Verdeans by Unemployment Among Ages 35 to 44 years

In terms of unemployment among ages 35 to 44 years, the demographic groups most similar to Cape Verdeans are Alaska Native (6.6%, a difference of 0.050%), Immigrants from Yemen (6.6%, a difference of 0.12%), Menominee (6.5%, a difference of 0.47%), Shoshone (6.6%, a difference of 0.69%), and Dominican (6.4%, a difference of 2.1%).
DemographicsRating | RankUnemployment Among Ages 35 to 44 years
Immigrants | Armenia
0.0
/100
|
#320
Tragic
6.2%
Chippewa
0.0
/100
|
#321
Tragic
6.2%
Immigrants | Dominican Republic
0.0
/100
|
#322
Tragic
6.4%
Dominicans
0.0
/100
|
#323
Tragic
6.4%
Menominee
0.0
/100
|
#324
Tragic
6.5%
Immigrants | Yemen
0.0
/100
|
#325
Tragic
6.6%
Alaska Natives
0.0
/100
|
#326
Tragic
6.6%
Cape Verdeans
0.0
/100
|
#327
Tragic
6.6%
Shoshone
0.0
/100
|
#328
Tragic
6.6%
Paiute
0.0
/100
|
#329
Tragic
6.9%
Immigrants | Cabo Verde
0.0
/100
|
#330
Tragic
6.9%
Pueblo
0.0
/100
|
#331
Tragic
7.1%
Natives/Alaskans
0.0
/100
|
#332
Tragic
7.3%
Puerto Ricans
0.0
/100
|
#333
Tragic
7.6%
Houma
0.0
/100
|
#334
Tragic
7.8%