Immigrants from Saudi Arabia vs Iranian Unemployment Among Seniors over 75 years
COMPARE
Immigrants from Saudi Arabia
Iranian
Unemployment Among Seniors over 75 years
Unemployment Among Seniors over 75 years Comparison
Immigrants from Saudi Arabia
Iranians
9.2%
UNEMPLOYMENT AMONG SENIORS OVER 75 YEARS
2.2/ 100
METRIC RATING
249th/ 347
METRIC RANK
7.9%
UNEMPLOYMENT AMONG SENIORS OVER 75 YEARS
99.9/ 100
METRIC RATING
58th/ 347
METRIC RANK
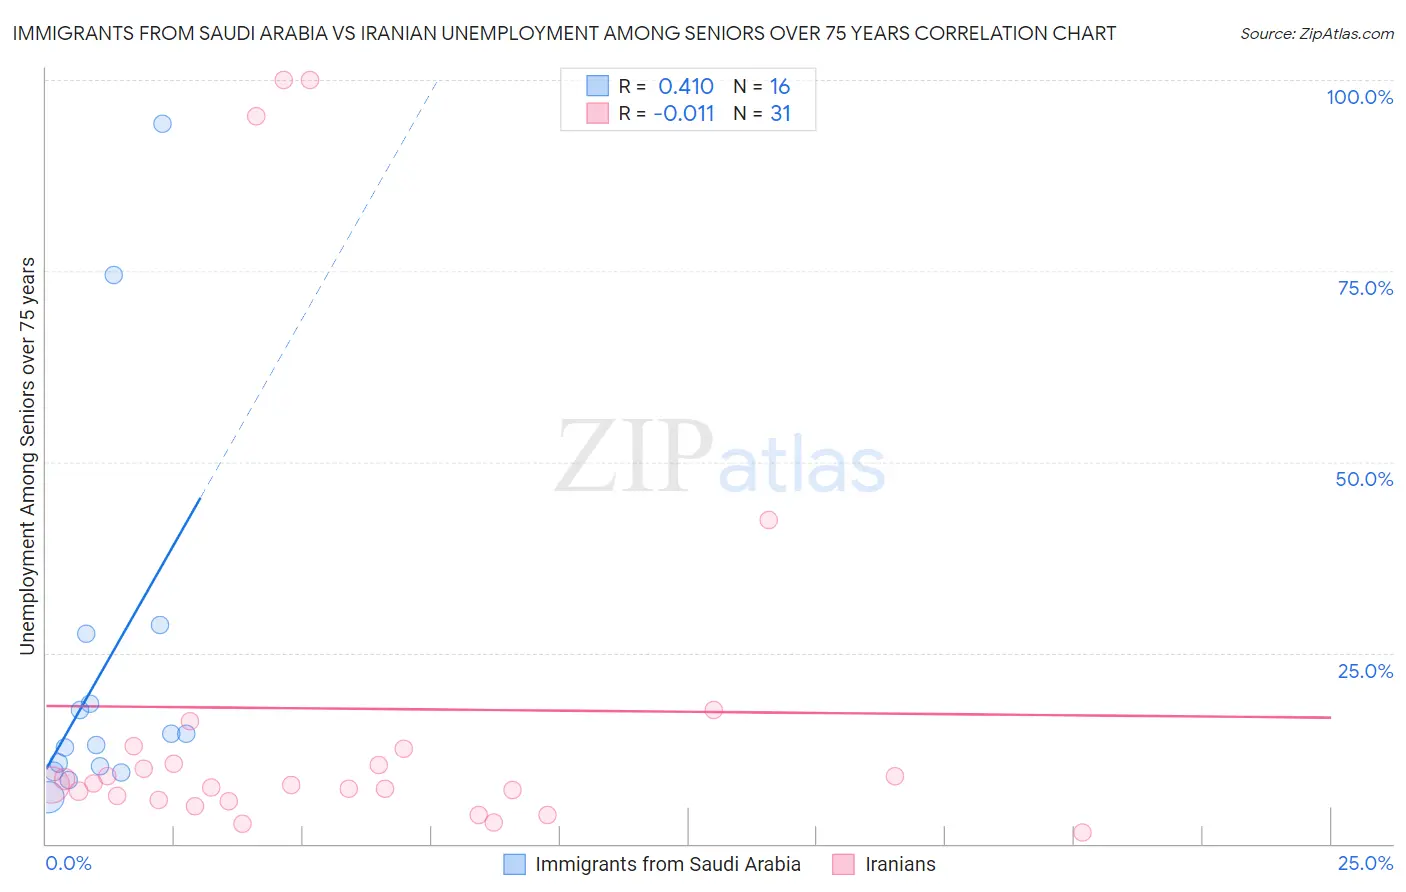
Immigrants from Saudi Arabia vs Iranian Unemployment Among Seniors over 75 years Correlation Chart
The statistical analysis conducted on geographies consisting of 112,716,416 people shows a moderate positive correlation between the proportion of Immigrants from Saudi Arabia and unemployment rate among seniors over the age of 75 in the United States with a correlation coefficient (R) of 0.410 and weighted average of 9.2%. Similarly, the statistical analysis conducted on geographies consisting of 179,955,362 people shows no correlation between the proportion of Iranians and unemployment rate among seniors over the age of 75 in the United States with a correlation coefficient (R) of -0.011 and weighted average of 7.9%, a difference of 16.3%.
Unemployment Among Seniors over 75 years Correlation Summary
| Measurement | Immigrants from Saudi Arabia | Iranian |
| Minimum | 6.1% | 1.4% |
| Maximum | 94.3% | 100.0% |
| Range | 88.2% | 98.6% |
| Mean | 23.0% | 17.7% |
| Median | 13.6% | 7.7% |
| Interquartile 25% (IQ1) | 9.8% | 5.7% |
| Interquartile 75% (IQ3) | 22.9% | 12.4% |
| Interquartile Range (IQR) | 13.1% | 6.7% |
| Standard Deviation (Sample) | 25.0% | 27.8% |
| Standard Deviation (Population) | 24.2% | 27.3% |
Similar Demographics by Unemployment Among Seniors over 75 years
Demographics Similar to Immigrants from Saudi Arabia by Unemployment Among Seniors over 75 years
In terms of unemployment among seniors over 75 years, the demographic groups most similar to Immigrants from Saudi Arabia are Central American Indian (9.2%, a difference of 0.010%), Blackfeet (9.2%, a difference of 0.050%), Subsaharan African (9.2%, a difference of 0.090%), Immigrants from North America (9.2%, a difference of 0.11%), and Immigrants from Poland (9.2%, a difference of 0.11%).
| Demographics | Rating | Rank | Unemployment Among Seniors over 75 years |
| Sierra Leoneans | 2.8 /100 | #242 | Tragic 9.2% |
| Slavs | 2.8 /100 | #243 | Tragic 9.2% |
| Immigrants | Germany | 2.7 /100 | #244 | Tragic 9.2% |
| Immigrants | Canada | 2.6 /100 | #245 | Tragic 9.2% |
| Immigrants | North America | 2.4 /100 | #246 | Tragic 9.2% |
| Sub-Saharan Africans | 2.3 /100 | #247 | Tragic 9.2% |
| Blackfeet | 2.3 /100 | #248 | Tragic 9.2% |
| Immigrants | Saudi Arabia | 2.2 /100 | #249 | Tragic 9.2% |
| Central American Indians | 2.2 /100 | #250 | Tragic 9.2% |
| Immigrants | Poland | 2.0 /100 | #251 | Tragic 9.2% |
| Immigrants | Sudan | 2.0 /100 | #252 | Tragic 9.2% |
| Pima | 1.8 /100 | #253 | Tragic 9.2% |
| Immigrants | Ghana | 1.7 /100 | #254 | Tragic 9.2% |
| Immigrants | Scotland | 1.4 /100 | #255 | Tragic 9.2% |
| Brazilians | 1.3 /100 | #256 | Tragic 9.3% |
Demographics Similar to Iranians by Unemployment Among Seniors over 75 years
In terms of unemployment among seniors over 75 years, the demographic groups most similar to Iranians are Ottawa (7.9%, a difference of 0.050%), Indonesian (7.9%, a difference of 0.20%), Immigrants from Eastern Asia (7.9%, a difference of 0.22%), Filipino (7.9%, a difference of 0.23%), and Immigrants from Morocco (7.9%, a difference of 0.25%).
| Demographics | Rating | Rank | Unemployment Among Seniors over 75 years |
| Moroccans | 100.0 /100 | #51 | Exceptional 7.8% |
| Bahamians | 100.0 /100 | #52 | Exceptional 7.8% |
| Immigrants | Egypt | 100.0 /100 | #53 | Exceptional 7.9% |
| Immigrants | Malaysia | 99.9 /100 | #54 | Exceptional 7.9% |
| Filipinos | 99.9 /100 | #55 | Exceptional 7.9% |
| Immigrants | Eastern Asia | 99.9 /100 | #56 | Exceptional 7.9% |
| Ottawa | 99.9 /100 | #57 | Exceptional 7.9% |
| Iranians | 99.9 /100 | #58 | Exceptional 7.9% |
| Indonesians | 99.9 /100 | #59 | Exceptional 7.9% |
| Immigrants | Morocco | 99.9 /100 | #60 | Exceptional 7.9% |
| Uruguayans | 99.9 /100 | #61 | Exceptional 7.9% |
| Immigrants | Albania | 99.9 /100 | #62 | Exceptional 7.9% |
| Immigrants | Nicaragua | 99.9 /100 | #63 | Exceptional 7.9% |
| Immigrants | Taiwan | 99.9 /100 | #64 | Exceptional 7.9% |
| Argentineans | 99.9 /100 | #65 | Exceptional 7.9% |