Immigrants from Saudi Arabia vs Immigrants from Turkey Unemployment Among Ages 30 to 34 years
COMPARE
Immigrants from Saudi Arabia
Immigrants from Turkey
Unemployment Among Ages 30 to 34 years
Unemployment Among Ages 30 to 34 years Comparison
Immigrants from Saudi Arabia
Immigrants from Turkey
5.0%
UNEMPLOYMENT AMONG AGES 30 TO 34 YEARS
99.3/ 100
METRIC RATING
33rd/ 347
METRIC RANK
5.0%
UNEMPLOYMENT AMONG AGES 30 TO 34 YEARS
99.0/ 100
METRIC RATING
37th/ 347
METRIC RANK
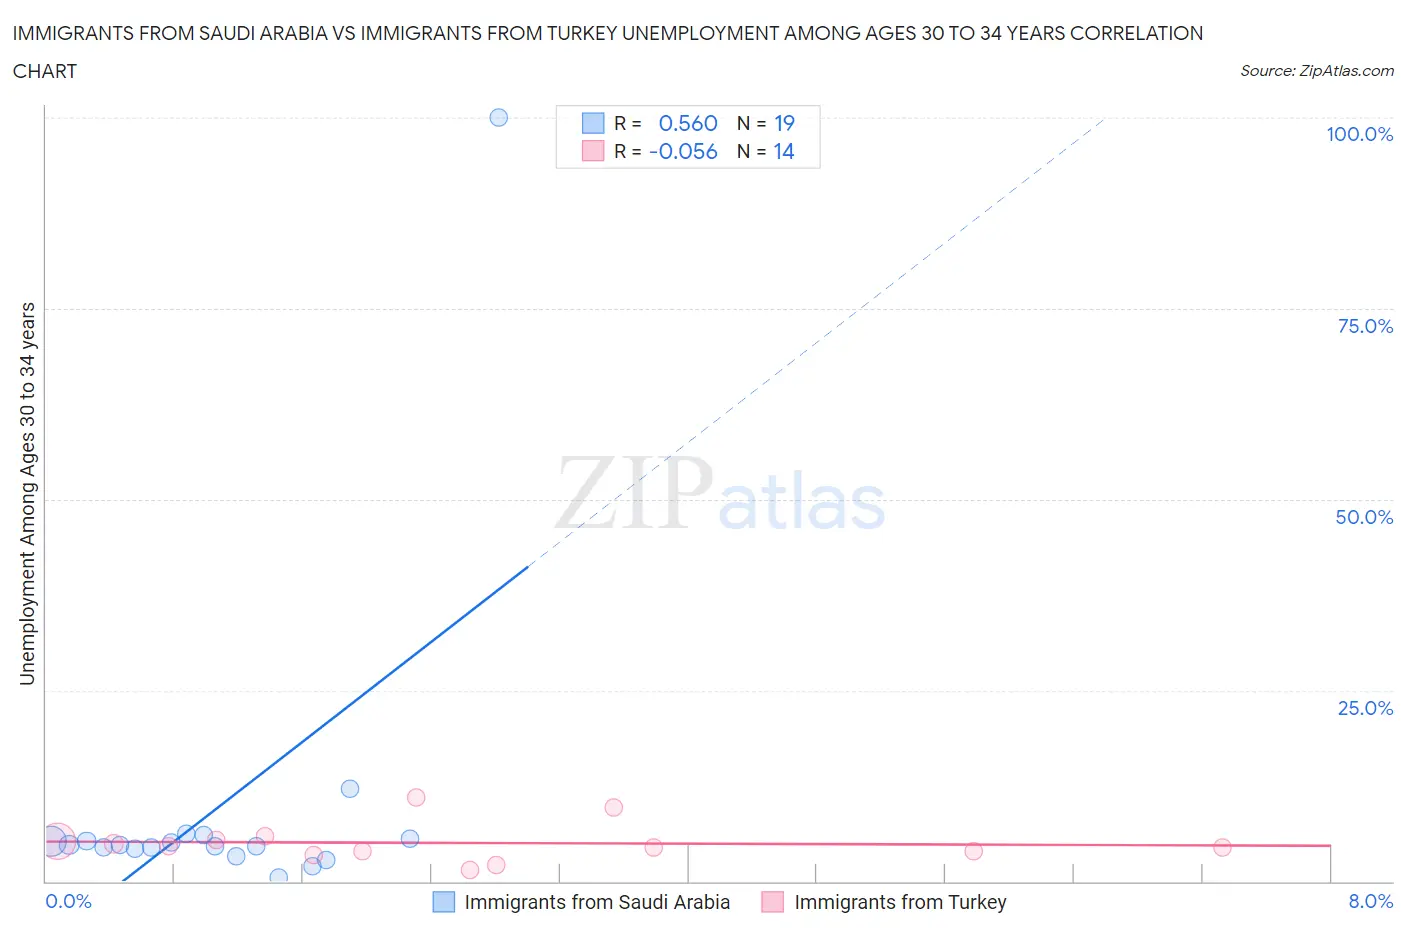
Immigrants from Saudi Arabia vs Immigrants from Turkey Unemployment Among Ages 30 to 34 years Correlation Chart
The statistical analysis conducted on geographies consisting of 161,358,115 people shows a substantial positive correlation between the proportion of Immigrants from Saudi Arabia and unemployment rate among population between the ages 30 and 34 in the United States with a correlation coefficient (R) of 0.560 and weighted average of 5.0%. Similarly, the statistical analysis conducted on geographies consisting of 215,515,010 people shows a slight negative correlation between the proportion of Immigrants from Turkey and unemployment rate among population between the ages 30 and 34 in the United States with a correlation coefficient (R) of -0.056 and weighted average of 5.0%, a difference of 0.58%.
Unemployment Among Ages 30 to 34 years Correlation Summary
| Measurement | Immigrants from Saudi Arabia | Immigrants from Turkey |
| Minimum | 0.48% | 1.4% |
| Maximum | 100.0% | 10.9% |
| Range | 99.5% | 9.5% |
| Mean | 9.8% | 5.0% |
| Median | 4.8% | 4.6% |
| Interquartile 25% (IQ1) | 4.3% | 4.0% |
| Interquartile 75% (IQ3) | 5.5% | 5.4% |
| Interquartile Range (IQR) | 1.2% | 1.4% |
| Standard Deviation (Sample) | 22.0% | 2.5% |
| Standard Deviation (Population) | 21.4% | 2.4% |
Demographics Similar to Immigrants from Saudi Arabia and Immigrants from Turkey by Unemployment Among Ages 30 to 34 years
In terms of unemployment among ages 30 to 34 years, the demographic groups most similar to Immigrants from Saudi Arabia are Latvian (5.0%, a difference of 0.050%), Immigrants from Zaire (5.0%, a difference of 0.10%), Somali (5.0%, a difference of 0.14%), Norwegian (5.0%, a difference of 0.23%), and German Russian (5.0%, a difference of 0.25%). Similarly, the demographic groups most similar to Immigrants from Turkey are Sri Lankan (5.0%, a difference of 0.0%), Fijian (5.0%, a difference of 0.10%), Immigrants from Vietnam (5.0%, a difference of 0.19%), Immigrants from Eastern Africa (5.0%, a difference of 0.19%), and Czech (5.0%, a difference of 0.25%).
| Demographics | Rating | Rank | Unemployment Among Ages 30 to 34 years |
| Immigrants | Singapore | 99.5 /100 | #25 | Exceptional 5.0% |
| Immigrants | Kuwait | 99.5 /100 | #26 | Exceptional 5.0% |
| Danes | 99.5 /100 | #27 | Exceptional 5.0% |
| Immigrants | Cuba | 99.4 /100 | #28 | Exceptional 5.0% |
| German Russians | 99.4 /100 | #29 | Exceptional 5.0% |
| Norwegians | 99.4 /100 | #30 | Exceptional 5.0% |
| Somalis | 99.3 /100 | #31 | Exceptional 5.0% |
| Immigrants | Zaire | 99.3 /100 | #32 | Exceptional 5.0% |
| Immigrants | Saudi Arabia | 99.3 /100 | #33 | Exceptional 5.0% |
| Latvians | 99.3 /100 | #34 | Exceptional 5.0% |
| Immigrants | Ethiopia | 99.2 /100 | #35 | Exceptional 5.0% |
| Czechs | 99.2 /100 | #36 | Exceptional 5.0% |
| Immigrants | Turkey | 99.0 /100 | #37 | Exceptional 5.0% |
| Sri Lankans | 99.0 /100 | #38 | Exceptional 5.0% |
| Fijians | 99.0 /100 | #39 | Exceptional 5.0% |
| Immigrants | Vietnam | 98.9 /100 | #40 | Exceptional 5.0% |
| Immigrants | Eastern Africa | 98.9 /100 | #41 | Exceptional 5.0% |
| Immigrants | Hong Kong | 98.8 /100 | #42 | Exceptional 5.0% |
| Soviet Union | 98.8 /100 | #43 | Exceptional 5.0% |
| Immigrants | Belgium | 98.7 /100 | #44 | Exceptional 5.1% |
| Yugoslavians | 98.6 /100 | #45 | Exceptional 5.1% |