Immigrants from Saudi Arabia vs Immigrants from Somalia Unemployment Among Women with Children Under 18 years
COMPARE
Immigrants from Saudi Arabia
Immigrants from Somalia
Unemployment Among Women with Children Under 18 years
Unemployment Among Women with Children Under 18 years Comparison
Immigrants from Saudi Arabia
Immigrants from Somalia
5.4%
UNEMPLOYMENT AMONG WOMEN WITH CHILDREN UNDER 18 YEARS
65.0/ 100
METRIC RATING
162nd/ 347
METRIC RANK
5.8%
UNEMPLOYMENT AMONG WOMEN WITH CHILDREN UNDER 18 YEARS
2.2/ 100
METRIC RATING
238th/ 347
METRIC RANK
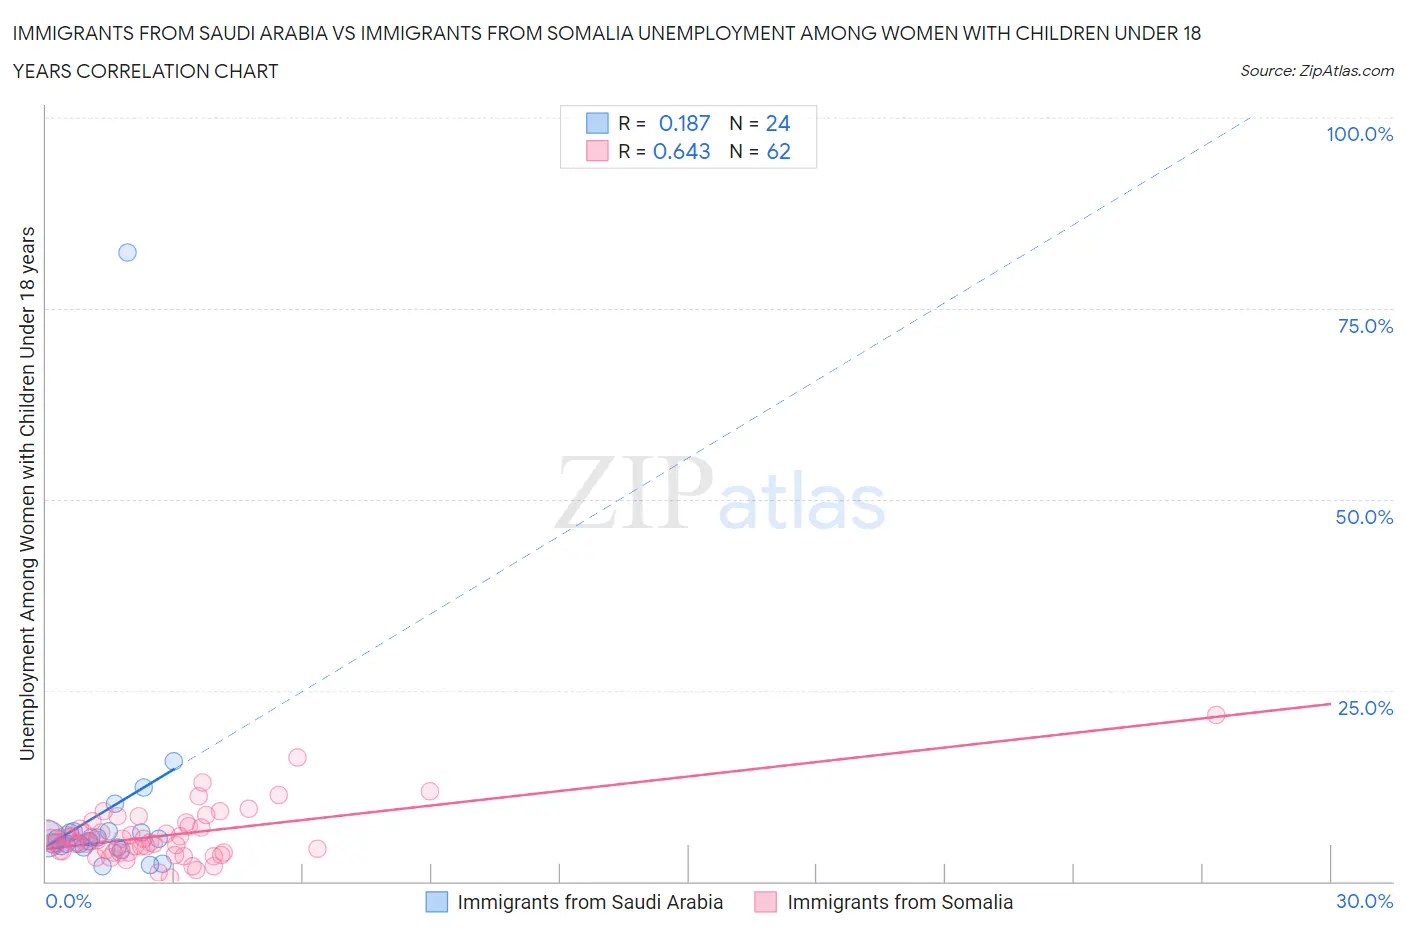
Immigrants from Saudi Arabia vs Immigrants from Somalia Unemployment Among Women with Children Under 18 years Correlation Chart
The statistical analysis conducted on geographies consisting of 162,263,235 people shows a poor positive correlation between the proportion of Immigrants from Saudi Arabia and unemployment rate among women with children under the age of 18 in the United States with a correlation coefficient (R) of 0.187 and weighted average of 5.4%. Similarly, the statistical analysis conducted on geographies consisting of 91,122,475 people shows a significant positive correlation between the proportion of Immigrants from Somalia and unemployment rate among women with children under the age of 18 in the United States with a correlation coefficient (R) of 0.643 and weighted average of 5.8%, a difference of 8.0%.
Unemployment Among Women with Children Under 18 years Correlation Summary
| Measurement | Immigrants from Saudi Arabia | Immigrants from Somalia |
| Minimum | 1.9% | 0.50% |
| Maximum | 82.4% | 21.7% |
| Range | 80.5% | 21.2% |
| Mean | 9.1% | 6.0% |
| Median | 5.5% | 5.2% |
| Interquartile 25% (IQ1) | 4.5% | 3.8% |
| Interquartile 75% (IQ3) | 6.5% | 7.0% |
| Interquartile Range (IQR) | 1.9% | 3.2% |
| Standard Deviation (Sample) | 15.9% | 3.5% |
| Standard Deviation (Population) | 15.6% | 3.5% |
Similar Demographics by Unemployment Among Women with Children Under 18 years
Demographics Similar to Immigrants from Saudi Arabia by Unemployment Among Women with Children Under 18 years
In terms of unemployment among women with children under 18 years, the demographic groups most similar to Immigrants from Saudi Arabia are Lebanese (5.4%, a difference of 0.030%), Immigrants from Iraq (5.4%, a difference of 0.070%), Afghan (5.4%, a difference of 0.12%), Celtic (5.4%, a difference of 0.16%), and Tlingit-Haida (5.4%, a difference of 0.24%).
| Demographics | Rating | Rank | Unemployment Among Women with Children Under 18 years |
| Koreans | 70.5 /100 | #155 | Good 5.4% |
| South Africans | 70.3 /100 | #156 | Good 5.4% |
| German Russians | 70.2 /100 | #157 | Good 5.4% |
| Immigrants | Burma/Myanmar | 69.5 /100 | #158 | Good 5.4% |
| Chickasaw | 68.4 /100 | #159 | Good 5.4% |
| Afghans | 66.6 /100 | #160 | Good 5.4% |
| Immigrants | Iraq | 65.9 /100 | #161 | Good 5.4% |
| Immigrants | Saudi Arabia | 65.0 /100 | #162 | Good 5.4% |
| Lebanese | 64.7 /100 | #163 | Good 5.4% |
| Celtics | 63.0 /100 | #164 | Good 5.4% |
| Tlingit-Haida | 61.9 /100 | #165 | Good 5.4% |
| Aleuts | 59.4 /100 | #166 | Average 5.4% |
| Immigrants | Denmark | 58.0 /100 | #167 | Average 5.4% |
| Immigrants | Northern Africa | 56.1 /100 | #168 | Average 5.4% |
| Immigrants | Thailand | 55.3 /100 | #169 | Average 5.4% |
Demographics Similar to Immigrants from Somalia by Unemployment Among Women with Children Under 18 years
In terms of unemployment among women with children under 18 years, the demographic groups most similar to Immigrants from Somalia are Immigrants from Sierra Leone (5.8%, a difference of 0.080%), Immigrants (5.8%, a difference of 0.090%), Immigrants from Lebanon (5.8%, a difference of 0.19%), Alsatian (5.8%, a difference of 0.28%), and Immigrants from Middle Africa (5.8%, a difference of 0.46%).
| Demographics | Rating | Rank | Unemployment Among Women with Children Under 18 years |
| Immigrants | Africa | 3.1 /100 | #231 | Tragic 5.8% |
| Creek | 3.1 /100 | #232 | Tragic 5.8% |
| Spanish Americans | 3.1 /100 | #233 | Tragic 5.8% |
| Guamanians/Chamorros | 2.9 /100 | #234 | Tragic 5.8% |
| Immigrants | Middle Africa | 2.8 /100 | #235 | Tragic 5.8% |
| Alsatians | 2.5 /100 | #236 | Tragic 5.8% |
| Immigrants | Lebanon | 2.4 /100 | #237 | Tragic 5.8% |
| Immigrants | Somalia | 2.2 /100 | #238 | Tragic 5.8% |
| Immigrants | Sierra Leone | 2.0 /100 | #239 | Tragic 5.8% |
| Immigrants | Immigrants | 2.0 /100 | #240 | Tragic 5.8% |
| Brazilians | 1.6 /100 | #241 | Tragic 5.8% |
| Moroccans | 1.4 /100 | #242 | Tragic 5.9% |
| Immigrants | Uruguay | 1.1 /100 | #243 | Tragic 5.9% |
| Choctaw | 1.1 /100 | #244 | Tragic 5.9% |
| Ugandans | 1.1 /100 | #245 | Tragic 5.9% |