Immigrants from Saudi Arabia vs Immigrants from Bolivia Unemployment Among Seniors over 65 years
COMPARE
Immigrants from Saudi Arabia
Immigrants from Bolivia
Unemployment Among Seniors over 65 years
Unemployment Among Seniors over 65 years Comparison
Immigrants from Saudi Arabia
Immigrants from Bolivia
5.0%
UNEMPLOYMENT AMONG SENIORS OVER 65 YEARS
92.7/ 100
METRIC RATING
110th/ 347
METRIC RANK
5.0%
UNEMPLOYMENT AMONG SENIORS OVER 65 YEARS
97.3/ 100
METRIC RATING
91st/ 347
METRIC RANK
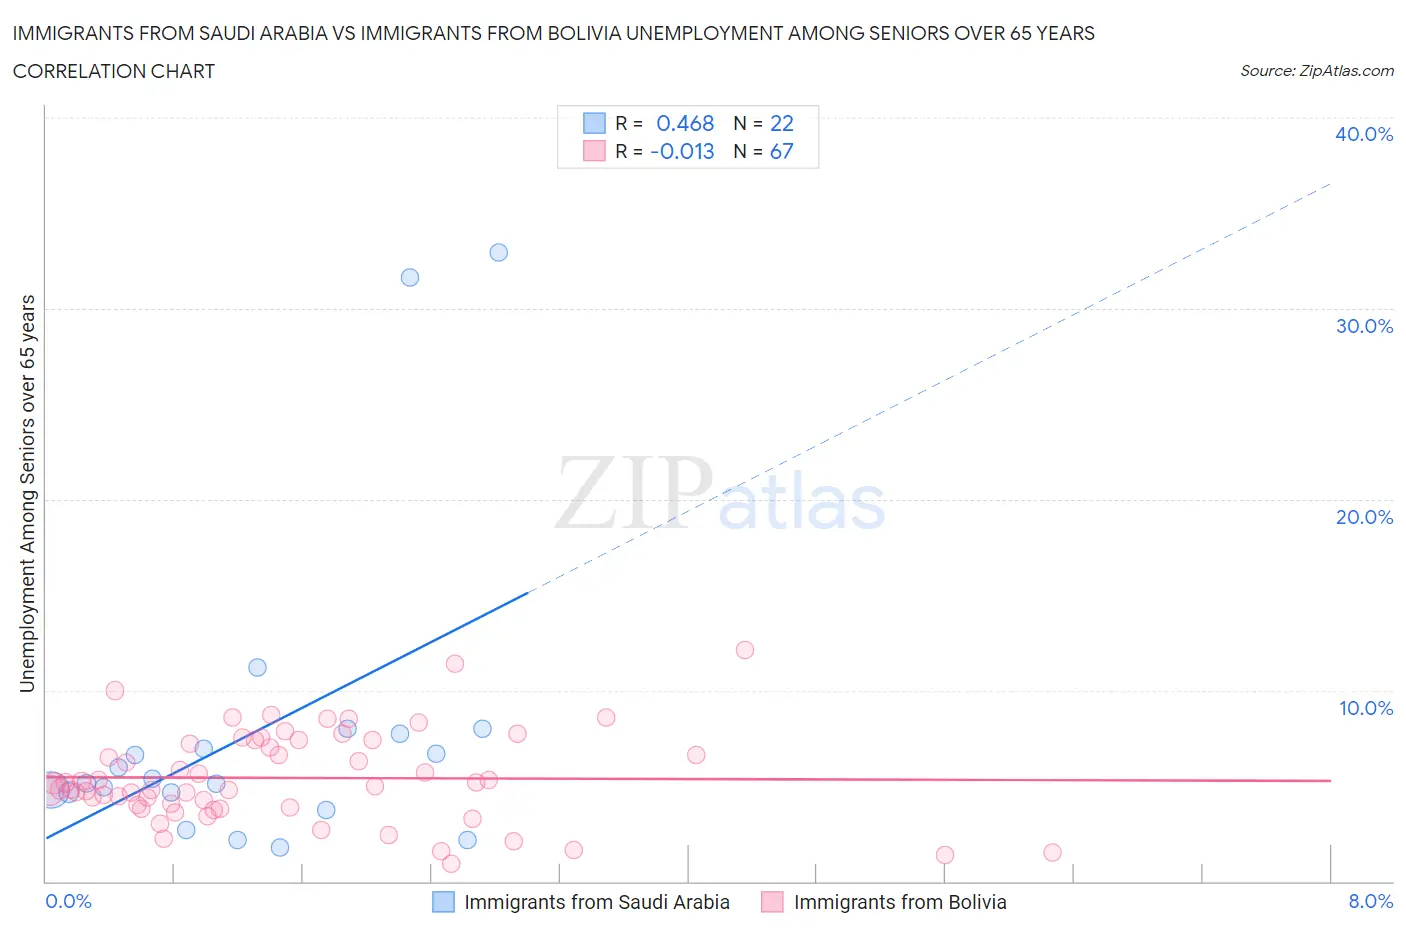
Immigrants from Saudi Arabia vs Immigrants from Bolivia Unemployment Among Seniors over 65 years Correlation Chart
The statistical analysis conducted on geographies consisting of 157,335,987 people shows a moderate positive correlation between the proportion of Immigrants from Saudi Arabia and unemployment rate amomg seniors over the age of 65 in the United States with a correlation coefficient (R) of 0.468 and weighted average of 5.0%. Similarly, the statistical analysis conducted on geographies consisting of 152,035,484 people shows no correlation between the proportion of Immigrants from Bolivia and unemployment rate amomg seniors over the age of 65 in the United States with a correlation coefficient (R) of -0.013 and weighted average of 5.0%, a difference of 0.87%.
Unemployment Among Seniors over 65 years Correlation Summary
| Measurement | Immigrants from Saudi Arabia | Immigrants from Bolivia |
| Minimum | 1.8% | 0.90% |
| Maximum | 32.9% | 12.1% |
| Range | 31.1% | 11.2% |
| Mean | 7.9% | 5.4% |
| Median | 5.3% | 5.0% |
| Interquartile 25% (IQ1) | 4.7% | 3.9% |
| Interquartile 75% (IQ3) | 7.7% | 7.4% |
| Interquartile Range (IQR) | 3.0% | 3.5% |
| Standard Deviation (Sample) | 8.2% | 2.4% |
| Standard Deviation (Population) | 8.0% | 2.3% |
Demographics Similar to Immigrants from Saudi Arabia and Immigrants from Bolivia by Unemployment Among Seniors over 65 years
In terms of unemployment among seniors over 65 years, the demographic groups most similar to Immigrants from Saudi Arabia are Immigrants from Malaysia (5.0%, a difference of 0.010%), Immigrants from Vietnam (5.0%, a difference of 0.030%), Immigrants from Germany (5.0%, a difference of 0.060%), Immigrants from Turkey (5.0%, a difference of 0.22%), and Okinawan (5.0%, a difference of 0.28%). Similarly, the demographic groups most similar to Immigrants from Bolivia are Immigrants from Bulgaria (5.0%, a difference of 0.020%), Austrian (5.0%, a difference of 0.020%), Immigrants from South Africa (5.0%, a difference of 0.080%), Burmese (5.0%, a difference of 0.14%), and Assyrian/Chaldean/Syriac (5.0%, a difference of 0.16%).
| Demographics | Rating | Rank | Unemployment Among Seniors over 65 years |
| Immigrants | South Africa | 97.6 /100 | #90 | Exceptional 5.0% |
| Immigrants | Bolivia | 97.3 /100 | #91 | Exceptional 5.0% |
| Immigrants | Bulgaria | 97.3 /100 | #92 | Exceptional 5.0% |
| Austrians | 97.3 /100 | #93 | Exceptional 5.0% |
| Burmese | 96.8 /100 | #94 | Exceptional 5.0% |
| Assyrians/Chaldeans/Syriacs | 96.8 /100 | #95 | Exceptional 5.0% |
| Immigrants | Singapore | 96.8 /100 | #96 | Exceptional 5.0% |
| Immigrants | Oceania | 96.8 /100 | #97 | Exceptional 5.0% |
| Czechoslovakians | 96.7 /100 | #98 | Exceptional 5.0% |
| South Africans | 96.5 /100 | #99 | Exceptional 5.0% |
| Romanians | 95.5 /100 | #100 | Exceptional 5.0% |
| Yugoslavians | 95.4 /100 | #101 | Exceptional 5.0% |
| Immigrants | Thailand | 95.4 /100 | #102 | Exceptional 5.0% |
| Immigrants | Lithuania | 95.1 /100 | #103 | Exceptional 5.0% |
| Immigrants | Scotland | 95.0 /100 | #104 | Exceptional 5.0% |
| Okinawans | 94.7 /100 | #105 | Exceptional 5.0% |
| Immigrants | Turkey | 94.3 /100 | #106 | Exceptional 5.0% |
| Immigrants | Germany | 93.2 /100 | #107 | Exceptional 5.0% |
| Immigrants | Vietnam | 92.9 /100 | #108 | Exceptional 5.0% |
| Immigrants | Malaysia | 92.7 /100 | #109 | Exceptional 5.0% |
| Immigrants | Saudi Arabia | 92.7 /100 | #110 | Exceptional 5.0% |