Immigrants from Romania vs Potawatomi Unemployment Among Ages 30 to 34 years
COMPARE
Immigrants from Romania
Potawatomi
Unemployment Among Ages 30 to 34 years
Unemployment Among Ages 30 to 34 years Comparison
Immigrants from Romania
Potawatomi
5.2%
UNEMPLOYMENT AMONG AGES 30 TO 34 YEARS
92.8/ 100
METRIC RATING
90th/ 347
METRIC RANK
6.0%
UNEMPLOYMENT AMONG AGES 30 TO 34 YEARS
0.2/ 100
METRIC RATING
252nd/ 347
METRIC RANK
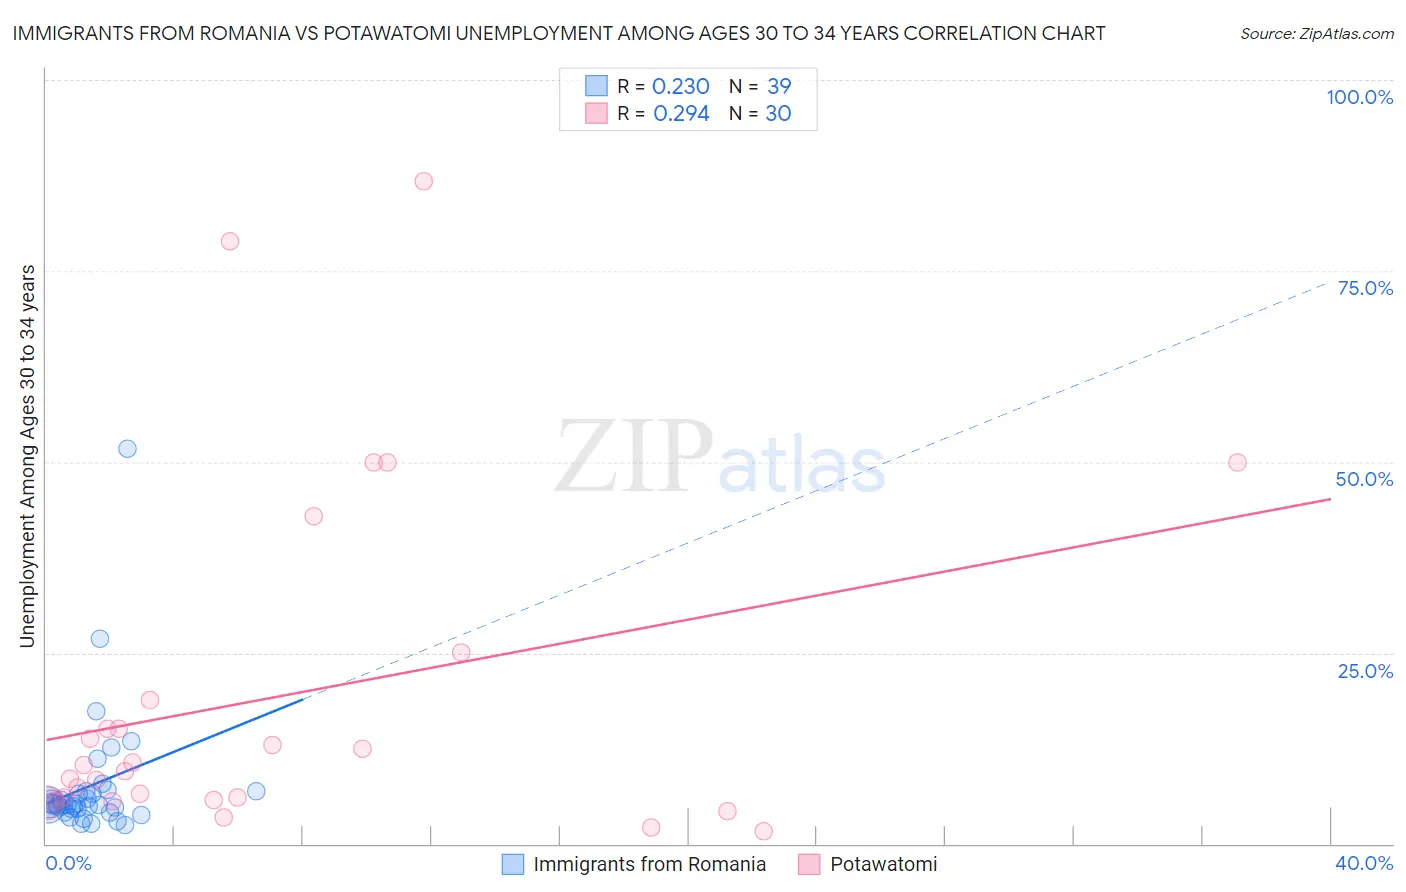
Immigrants from Romania vs Potawatomi Unemployment Among Ages 30 to 34 years Correlation Chart
The statistical analysis conducted on geographies consisting of 247,665,537 people shows a weak positive correlation between the proportion of Immigrants from Romania and unemployment rate among population between the ages 30 and 34 in the United States with a correlation coefficient (R) of 0.230 and weighted average of 5.2%. Similarly, the statistical analysis conducted on geographies consisting of 114,286,422 people shows a weak positive correlation between the proportion of Potawatomi and unemployment rate among population between the ages 30 and 34 in the United States with a correlation coefficient (R) of 0.294 and weighted average of 6.0%, a difference of 15.6%.
Unemployment Among Ages 30 to 34 years Correlation Summary
| Measurement | Immigrants from Romania | Potawatomi |
| Minimum | 2.4% | 1.6% |
| Maximum | 51.7% | 86.7% |
| Range | 49.3% | 85.1% |
| Mean | 7.6% | 19.3% |
| Median | 5.1% | 9.9% |
| Interquartile 25% (IQ1) | 4.6% | 5.7% |
| Interquartile 75% (IQ3) | 6.9% | 18.8% |
| Interquartile Range (IQR) | 2.3% | 13.1% |
| Standard Deviation (Sample) | 8.5% | 22.5% |
| Standard Deviation (Population) | 8.4% | 22.1% |
Similar Demographics by Unemployment Among Ages 30 to 34 years
Demographics Similar to Immigrants from Romania by Unemployment Among Ages 30 to 34 years
In terms of unemployment among ages 30 to 34 years, the demographic groups most similar to Immigrants from Romania are Iraqi (5.2%, a difference of 0.050%), Immigrants from Argentina (5.2%, a difference of 0.070%), Laotian (5.2%, a difference of 0.12%), Maltese (5.2%, a difference of 0.12%), and Immigrants from Sweden (5.2%, a difference of 0.14%).
| Demographics | Rating | Rank | Unemployment Among Ages 30 to 34 years |
| Immigrants | Korea | 94.1 /100 | #83 | Exceptional 5.2% |
| Immigrants | Uganda | 94.0 /100 | #84 | Exceptional 5.2% |
| Immigrants | Egypt | 93.9 /100 | #85 | Exceptional 5.2% |
| Immigrants | Australia | 93.5 /100 | #86 | Exceptional 5.2% |
| Bhutanese | 93.5 /100 | #87 | Exceptional 5.2% |
| Immigrants | Kenya | 93.3 /100 | #88 | Exceptional 5.2% |
| Immigrants | Sweden | 93.3 /100 | #89 | Exceptional 5.2% |
| Immigrants | Romania | 92.8 /100 | #90 | Exceptional 5.2% |
| Iraqis | 92.6 /100 | #91 | Exceptional 5.2% |
| Immigrants | Argentina | 92.5 /100 | #92 | Exceptional 5.2% |
| Laotians | 92.4 /100 | #93 | Exceptional 5.2% |
| Maltese | 92.3 /100 | #94 | Exceptional 5.2% |
| Kenyans | 92.1 /100 | #95 | Exceptional 5.2% |
| Mongolians | 91.7 /100 | #96 | Exceptional 5.2% |
| Europeans | 91.7 /100 | #97 | Exceptional 5.2% |
Demographics Similar to Potawatomi by Unemployment Among Ages 30 to 34 years
In terms of unemployment among ages 30 to 34 years, the demographic groups most similar to Potawatomi are Tlingit-Haida (6.0%, a difference of 0.020%), Immigrants from Honduras (6.0%, a difference of 0.21%), Honduran (6.0%, a difference of 0.30%), Nigerian (6.0%, a difference of 0.31%), and Immigrants from Guatemala (6.0%, a difference of 0.31%).
| Demographics | Rating | Rank | Unemployment Among Ages 30 to 34 years |
| Sub-Saharan Africans | 0.3 /100 | #245 | Tragic 6.0% |
| Ghanaians | 0.3 /100 | #246 | Tragic 6.0% |
| Nigerians | 0.3 /100 | #247 | Tragic 6.0% |
| Immigrants | Guatemala | 0.3 /100 | #248 | Tragic 6.0% |
| Hondurans | 0.3 /100 | #249 | Tragic 6.0% |
| Immigrants | Honduras | 0.3 /100 | #250 | Tragic 6.0% |
| Tlingit-Haida | 0.2 /100 | #251 | Tragic 6.0% |
| Potawatomi | 0.2 /100 | #252 | Tragic 6.0% |
| Immigrants | Nonimmigrants | 0.2 /100 | #253 | Tragic 6.1% |
| Armenians | 0.1 /100 | #254 | Tragic 6.1% |
| Immigrants | Portugal | 0.1 /100 | #255 | Tragic 6.1% |
| Immigrants | Ghana | 0.1 /100 | #256 | Tragic 6.1% |
| Immigrants | Sierra Leone | 0.1 /100 | #257 | Tragic 6.1% |
| Mexicans | 0.1 /100 | #258 | Tragic 6.1% |
| Haitians | 0.1 /100 | #259 | Tragic 6.1% |