Immigrants from Romania vs Immigrants from Eastern Asia Male Unemployment
COMPARE
Immigrants from Romania
Immigrants from Eastern Asia
Male Unemployment
Male Unemployment Comparison
Immigrants from Romania
Immigrants from Eastern Asia
5.1%
MALE UNEMPLOYMENT
95.4/ 100
METRIC RATING
87th/ 347
METRIC RANK
5.1%
MALE UNEMPLOYMENT
90.8/ 100
METRIC RATING
111th/ 347
METRIC RANK
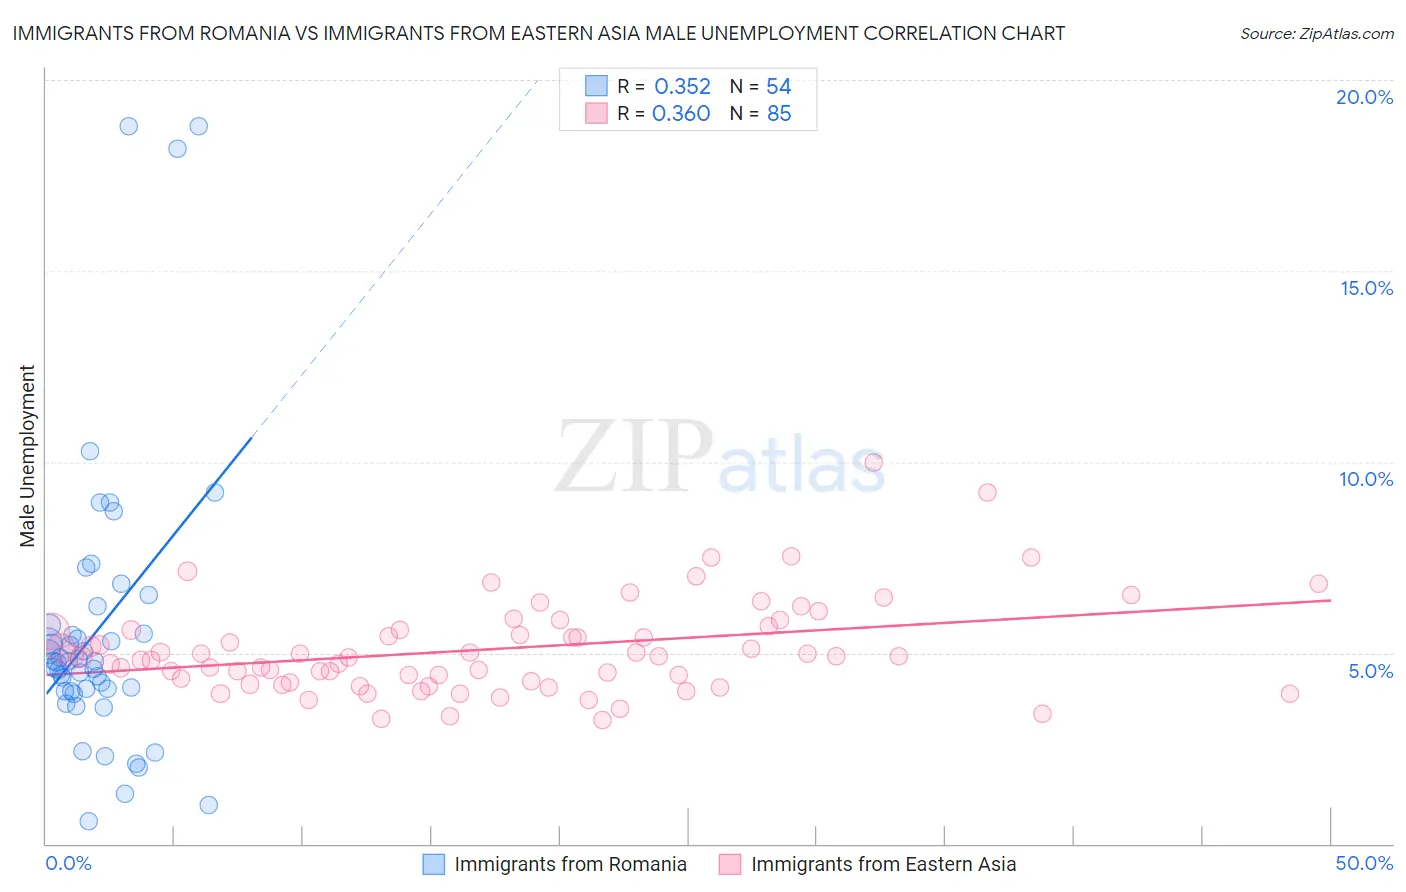
Immigrants from Romania vs Immigrants from Eastern Asia Male Unemployment Correlation Chart
The statistical analysis conducted on geographies consisting of 256,547,728 people shows a mild positive correlation between the proportion of Immigrants from Romania and unemployment rate among males in the United States with a correlation coefficient (R) of 0.352 and weighted average of 5.1%. Similarly, the statistical analysis conducted on geographies consisting of 496,101,310 people shows a mild positive correlation between the proportion of Immigrants from Eastern Asia and unemployment rate among males in the United States with a correlation coefficient (R) of 0.360 and weighted average of 5.1%, a difference of 1.1%.
Male Unemployment Correlation Summary
| Measurement | Immigrants from Romania | Immigrants from Eastern Asia |
| Minimum | 0.60% | 3.2% |
| Maximum | 18.8% | 10.0% |
| Range | 18.2% | 6.8% |
| Mean | 5.6% | 5.1% |
| Median | 4.8% | 4.9% |
| Interquartile 25% (IQ1) | 4.0% | 4.2% |
| Interquartile 75% (IQ3) | 5.7% | 5.6% |
| Interquartile Range (IQR) | 1.7% | 1.4% |
| Standard Deviation (Sample) | 3.8% | 1.2% |
| Standard Deviation (Population) | 3.7% | 1.2% |
Similar Demographics by Male Unemployment
Demographics Similar to Immigrants from Romania by Male Unemployment
In terms of male unemployment, the demographic groups most similar to Immigrants from Romania are Maltese (5.1%, a difference of 0.020%), Immigrants from North Macedonia (5.1%, a difference of 0.060%), Serbian (5.1%, a difference of 0.11%), Immigrants from Sri Lanka (5.1%, a difference of 0.19%), and Immigrants from Eritrea (5.0%, a difference of 0.22%).
| Demographics | Rating | Rank | Male Unemployment |
| Argentineans | 96.2 /100 | #80 | Exceptional 5.0% |
| French | 96.2 /100 | #81 | Exceptional 5.0% |
| Chileans | 96.2 /100 | #82 | Exceptional 5.0% |
| Immigrants | Eritrea | 96.0 /100 | #83 | Exceptional 5.0% |
| Serbians | 95.7 /100 | #84 | Exceptional 5.1% |
| Immigrants | North Macedonia | 95.6 /100 | #85 | Exceptional 5.1% |
| Maltese | 95.5 /100 | #86 | Exceptional 5.1% |
| Immigrants | Romania | 95.4 /100 | #87 | Exceptional 5.1% |
| Immigrants | Sri Lanka | 94.9 /100 | #88 | Exceptional 5.1% |
| Immigrants | Australia | 94.7 /100 | #89 | Exceptional 5.1% |
| Okinawans | 94.7 /100 | #90 | Exceptional 5.1% |
| Immigrants | Turkey | 94.4 /100 | #91 | Exceptional 5.1% |
| Slavs | 94.2 /100 | #92 | Exceptional 5.1% |
| Immigrants | Serbia | 94.2 /100 | #93 | Exceptional 5.1% |
| Canadians | 94.1 /100 | #94 | Exceptional 5.1% |
Demographics Similar to Immigrants from Eastern Asia by Male Unemployment
In terms of male unemployment, the demographic groups most similar to Immigrants from Eastern Asia are Immigrants from England (5.1%, a difference of 0.010%), Immigrants from Pakistan (5.1%, a difference of 0.030%), Immigrants from Moldova (5.1%, a difference of 0.080%), Immigrants from Nicaragua (5.1%, a difference of 0.090%), and Immigrants from Austria (5.1%, a difference of 0.090%).
| Demographics | Rating | Rank | Male Unemployment |
| Immigrants | Chile | 91.8 /100 | #104 | Exceptional 5.1% |
| Immigrants | Czechoslovakia | 91.7 /100 | #105 | Exceptional 5.1% |
| Immigrants | Ethiopia | 91.5 /100 | #106 | Exceptional 5.1% |
| Ethiopians | 91.3 /100 | #107 | Exceptional 5.1% |
| Immigrants | Nicaragua | 91.2 /100 | #108 | Exceptional 5.1% |
| Immigrants | Pakistan | 90.9 /100 | #109 | Exceptional 5.1% |
| Immigrants | England | 90.8 /100 | #110 | Exceptional 5.1% |
| Immigrants | Eastern Asia | 90.8 /100 | #111 | Exceptional 5.1% |
| Immigrants | Moldova | 90.3 /100 | #112 | Exceptional 5.1% |
| Immigrants | Austria | 90.3 /100 | #113 | Exceptional 5.1% |
| Romanians | 89.8 /100 | #114 | Excellent 5.1% |
| Immigrants | Asia | 89.6 /100 | #115 | Excellent 5.1% |
| Immigrants | Denmark | 89.4 /100 | #116 | Excellent 5.1% |
| Estonians | 89.0 /100 | #117 | Excellent 5.1% |
| Cypriots | 88.8 /100 | #118 | Excellent 5.1% |