Immigrants from Romania vs Cape Verdean Unemployment Among Ages 20 to 24 years
COMPARE
Immigrants from Romania
Cape Verdean
Unemployment Among Ages 20 to 24 years
Unemployment Among Ages 20 to 24 years Comparison
Immigrants from Romania
Cape Verdeans
10.2%
UNEMPLOYMENT AMONG AGES 20 TO 24 YEARS
75.7/ 100
METRIC RATING
148th/ 347
METRIC RANK
11.5%
UNEMPLOYMENT AMONG AGES 20 TO 24 YEARS
0.0/ 100
METRIC RATING
274th/ 347
METRIC RANK
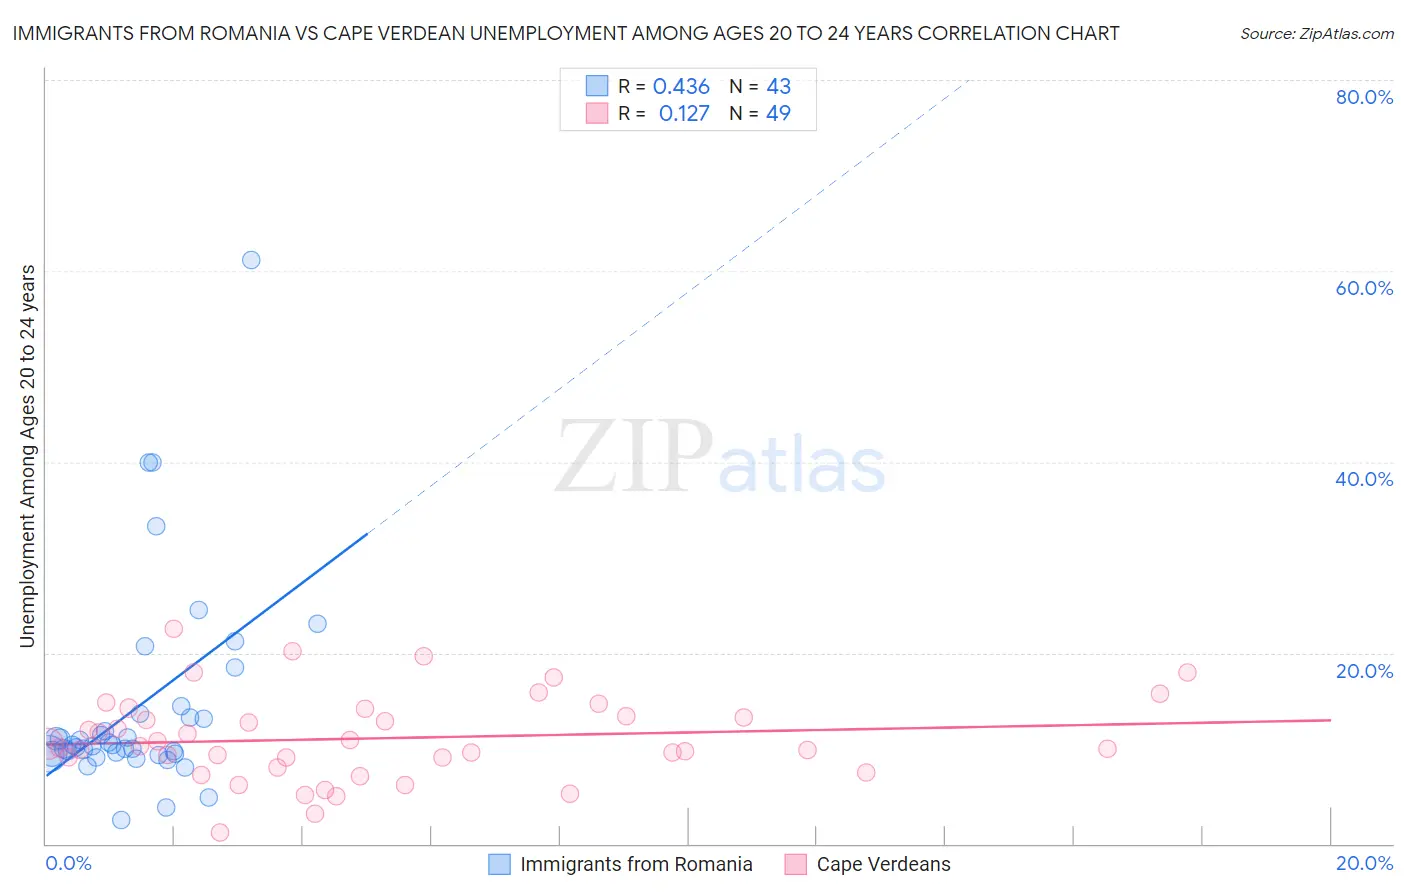
Immigrants from Romania vs Cape Verdean Unemployment Among Ages 20 to 24 years Correlation Chart
The statistical analysis conducted on geographies consisting of 252,732,931 people shows a moderate positive correlation between the proportion of Immigrants from Romania and unemployment rate among population between the ages 20 and 24 in the United States with a correlation coefficient (R) of 0.436 and weighted average of 10.2%. Similarly, the statistical analysis conducted on geographies consisting of 106,606,919 people shows a poor positive correlation between the proportion of Cape Verdeans and unemployment rate among population between the ages 20 and 24 in the United States with a correlation coefficient (R) of 0.127 and weighted average of 11.5%, a difference of 12.6%.
Unemployment Among Ages 20 to 24 years Correlation Summary
| Measurement | Immigrants from Romania | Cape Verdean |
| Minimum | 2.4% | 1.2% |
| Maximum | 61.1% | 22.5% |
| Range | 58.7% | 21.3% |
| Mean | 14.3% | 11.0% |
| Median | 10.3% | 10.3% |
| Interquartile 25% (IQ1) | 9.4% | 8.5% |
| Interquartile 75% (IQ3) | 13.6% | 13.8% |
| Interquartile Range (IQR) | 4.2% | 5.3% |
| Standard Deviation (Sample) | 11.0% | 4.5% |
| Standard Deviation (Population) | 10.8% | 4.4% |
Similar Demographics by Unemployment Among Ages 20 to 24 years
Demographics Similar to Immigrants from Romania by Unemployment Among Ages 20 to 24 years
In terms of unemployment among ages 20 to 24 years, the demographic groups most similar to Immigrants from Romania are Immigrants from Scotland (10.2%, a difference of 0.060%), Hungarian (10.2%, a difference of 0.060%), French Canadian (10.2%, a difference of 0.090%), Asian (10.2%, a difference of 0.10%), and Immigrants from South Africa (10.2%, a difference of 0.10%).
| Demographics | Rating | Rank | Unemployment Among Ages 20 to 24 years |
| Immigrants | Azores | 81.4 /100 | #141 | Excellent 10.2% |
| Slovaks | 80.2 /100 | #142 | Excellent 10.2% |
| Immigrants | Jordan | 79.0 /100 | #143 | Good 10.2% |
| Brazilians | 78.4 /100 | #144 | Good 10.2% |
| Argentineans | 78.0 /100 | #145 | Good 10.2% |
| Asians | 77.7 /100 | #146 | Good 10.2% |
| French Canadians | 77.5 /100 | #147 | Good 10.2% |
| Immigrants | Romania | 75.7 /100 | #148 | Good 10.2% |
| Immigrants | Scotland | 74.6 /100 | #149 | Good 10.2% |
| Hungarians | 74.4 /100 | #150 | Good 10.2% |
| Immigrants | South Africa | 73.6 /100 | #151 | Good 10.2% |
| Iranians | 72.4 /100 | #152 | Good 10.2% |
| Immigrants | Taiwan | 71.4 /100 | #153 | Good 10.2% |
| Immigrants | Switzerland | 71.3 /100 | #154 | Good 10.2% |
| Lithuanians | 70.0 /100 | #155 | Good 10.2% |
Demographics Similar to Cape Verdeans by Unemployment Among Ages 20 to 24 years
In terms of unemployment among ages 20 to 24 years, the demographic groups most similar to Cape Verdeans are Immigrants from Nigeria (11.5%, a difference of 0.080%), Senegalese (11.5%, a difference of 0.36%), Sierra Leonean (11.5%, a difference of 0.40%), African (11.5%, a difference of 0.54%), and Colville (11.6%, a difference of 0.57%).
| Demographics | Rating | Rank | Unemployment Among Ages 20 to 24 years |
| Immigrants | Greece | 0.0 /100 | #267 | Tragic 11.1% |
| Maltese | 0.0 /100 | #268 | Tragic 11.2% |
| Ute | 0.0 /100 | #269 | Tragic 11.2% |
| Delaware | 0.0 /100 | #270 | Tragic 11.3% |
| Immigrants | Uzbekistan | 0.0 /100 | #271 | Tragic 11.4% |
| Nigerians | 0.0 /100 | #272 | Tragic 11.4% |
| Immigrants | Nigeria | 0.0 /100 | #273 | Tragic 11.5% |
| Cape Verdeans | 0.0 /100 | #274 | Tragic 11.5% |
| Senegalese | 0.0 /100 | #275 | Tragic 11.5% |
| Sierra Leoneans | 0.0 /100 | #276 | Tragic 11.5% |
| Africans | 0.0 /100 | #277 | Tragic 11.5% |
| Colville | 0.0 /100 | #278 | Tragic 11.6% |
| Bahamians | 0.0 /100 | #279 | Tragic 11.6% |
| Alaskan Athabascans | 0.0 /100 | #280 | Tragic 11.6% |
| Armenians | 0.0 /100 | #281 | Tragic 11.7% |