Immigrants from Portugal vs Sri Lankan Unemployment Among Ages 25 to 29 years
COMPARE
Immigrants from Portugal
Sri Lankan
Unemployment Among Ages 25 to 29 years
Unemployment Among Ages 25 to 29 years Comparison
Immigrants from Portugal
Sri Lankans
7.2%
UNEMPLOYMENT AMONG AGES 25 TO 29 YEARS
0.3/ 100
METRIC RATING
253rd/ 347
METRIC RANK
6.5%
UNEMPLOYMENT AMONG AGES 25 TO 29 YEARS
80.3/ 100
METRIC RATING
129th/ 347
METRIC RANK
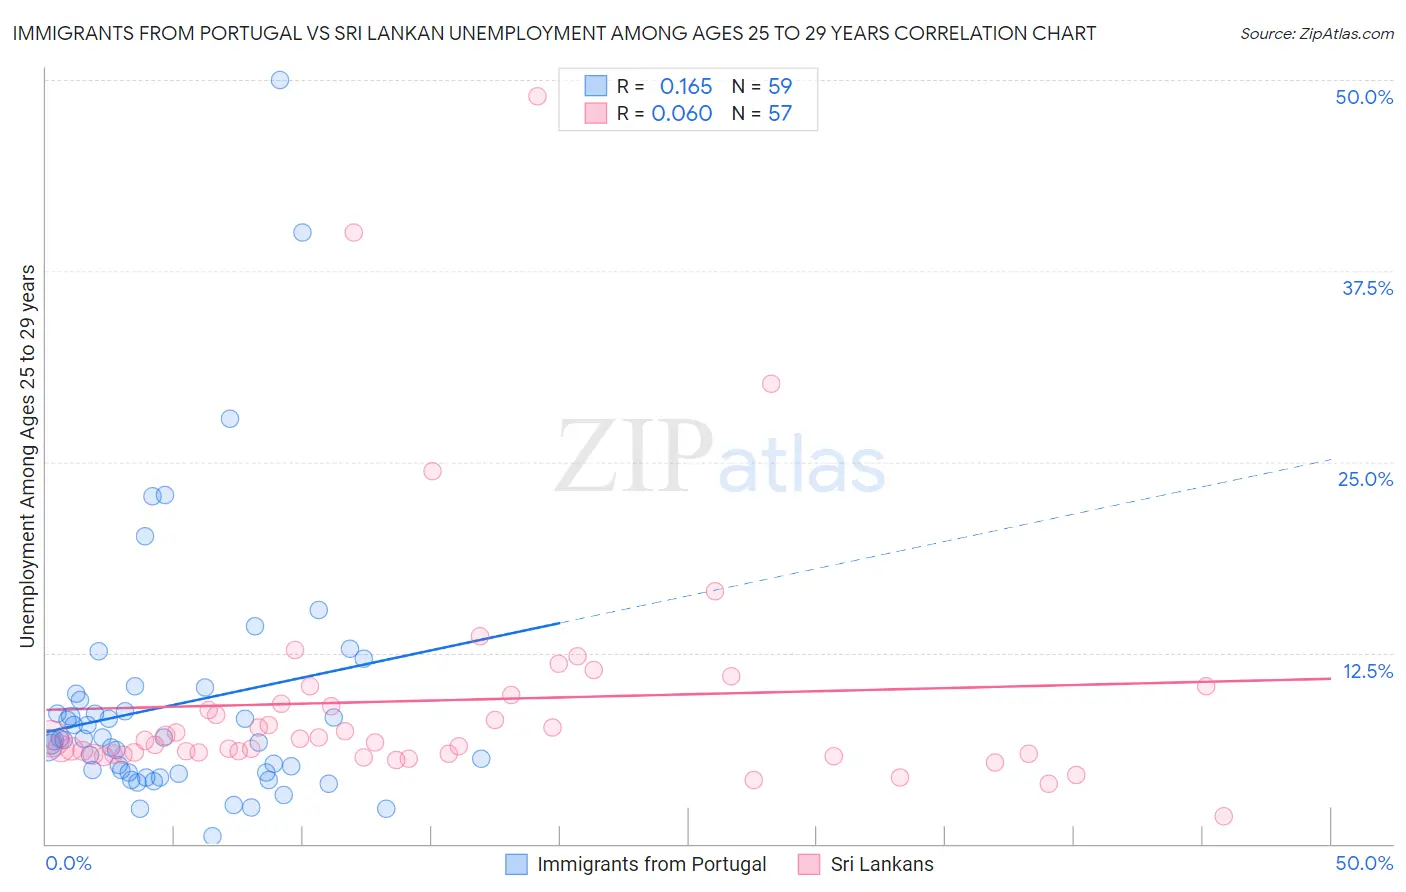
Immigrants from Portugal vs Sri Lankan Unemployment Among Ages 25 to 29 years Correlation Chart
The statistical analysis conducted on geographies consisting of 169,562,653 people shows a poor positive correlation between the proportion of Immigrants from Portugal and unemployment rate among population between the ages 25 and 29 in the United States with a correlation coefficient (R) of 0.165 and weighted average of 7.2%. Similarly, the statistical analysis conducted on geographies consisting of 417,939,567 people shows a slight positive correlation between the proportion of Sri Lankans and unemployment rate among population between the ages 25 and 29 in the United States with a correlation coefficient (R) of 0.060 and weighted average of 6.5%, a difference of 11.2%.
Unemployment Among Ages 25 to 29 years Correlation Summary
| Measurement | Immigrants from Portugal | Sri Lankan |
| Minimum | 0.50% | 1.8% |
| Maximum | 50.0% | 48.9% |
| Range | 49.5% | 47.1% |
| Mean | 9.1% | 9.4% |
| Median | 6.8% | 6.8% |
| Interquartile 25% (IQ1) | 4.7% | 5.9% |
| Interquartile 75% (IQ3) | 9.4% | 9.5% |
| Interquartile Range (IQR) | 4.7% | 3.6% |
| Standard Deviation (Sample) | 8.6% | 8.2% |
| Standard Deviation (Population) | 8.5% | 8.1% |
Similar Demographics by Unemployment Among Ages 25 to 29 years
Demographics Similar to Immigrants from Portugal by Unemployment Among Ages 25 to 29 years
In terms of unemployment among ages 25 to 29 years, the demographic groups most similar to Immigrants from Portugal are Ghanaian (7.2%, a difference of 0.15%), Immigrants from Cameroon (7.2%, a difference of 0.21%), Sierra Leonean (7.2%, a difference of 0.32%), Mexican American Indian (7.3%, a difference of 0.40%), and Portuguese (7.2%, a difference of 0.58%).
| Demographics | Rating | Rank | Unemployment Among Ages 25 to 29 years |
| Immigrants | Uzbekistan | 0.7 /100 | #246 | Tragic 7.2% |
| Immigrants | Guatemala | 0.7 /100 | #247 | Tragic 7.2% |
| Sub-Saharan Africans | 0.6 /100 | #248 | Tragic 7.2% |
| Seminole | 0.6 /100 | #249 | Tragic 7.2% |
| Delaware | 0.5 /100 | #250 | Tragic 7.2% |
| Portuguese | 0.5 /100 | #251 | Tragic 7.2% |
| Sierra Leoneans | 0.4 /100 | #252 | Tragic 7.2% |
| Immigrants | Portugal | 0.3 /100 | #253 | Tragic 7.2% |
| Ghanaians | 0.3 /100 | #254 | Tragic 7.2% |
| Immigrants | Cameroon | 0.3 /100 | #255 | Tragic 7.2% |
| Mexican American Indians | 0.3 /100 | #256 | Tragic 7.3% |
| Assyrians/Chaldeans/Syriacs | 0.2 /100 | #257 | Tragic 7.3% |
| Ottawa | 0.1 /100 | #258 | Tragic 7.3% |
| Cree | 0.1 /100 | #259 | Tragic 7.3% |
| Americans | 0.1 /100 | #260 | Tragic 7.4% |
Demographics Similar to Sri Lankans by Unemployment Among Ages 25 to 29 years
In terms of unemployment among ages 25 to 29 years, the demographic groups most similar to Sri Lankans are Immigrants from Chile (6.5%, a difference of 0.020%), Immigrants from Peru (6.5%, a difference of 0.030%), Dutch (6.5%, a difference of 0.040%), Immigrants from Afghanistan (6.5%, a difference of 0.11%), and Brazilian (6.5%, a difference of 0.17%).
| Demographics | Rating | Rank | Unemployment Among Ages 25 to 29 years |
| Immigrants | Belarus | 83.7 /100 | #122 | Excellent 6.5% |
| Laotians | 83.6 /100 | #123 | Excellent 6.5% |
| Arabs | 82.5 /100 | #124 | Excellent 6.5% |
| Syrians | 82.1 /100 | #125 | Excellent 6.5% |
| Brazilians | 81.9 /100 | #126 | Excellent 6.5% |
| Dutch | 80.6 /100 | #127 | Excellent 6.5% |
| Immigrants | Chile | 80.5 /100 | #128 | Excellent 6.5% |
| Sri Lankans | 80.3 /100 | #129 | Excellent 6.5% |
| Immigrants | Peru | 79.9 /100 | #130 | Good 6.5% |
| Immigrants | Afghanistan | 79.2 /100 | #131 | Good 6.5% |
| Poles | 76.6 /100 | #132 | Good 6.5% |
| Immigrants | Europe | 75.7 /100 | #133 | Good 6.5% |
| Immigrants | Vietnam | 75.6 /100 | #134 | Good 6.5% |
| Immigrants | Croatia | 75.5 /100 | #135 | Good 6.5% |
| Northern Europeans | 75.4 /100 | #136 | Good 6.5% |