Immigrants from Portugal vs Immigrants from Costa Rica Unemployment Among Women with Children Under 6 years
COMPARE
Immigrants from Portugal
Immigrants from Costa Rica
Unemployment Among Women with Children Under 6 years
Unemployment Among Women with Children Under 6 years Comparison
Immigrants from Portugal
Immigrants from Costa Rica
8.3%
UNEMPLOYMENT AMONG WOMEN WITH CHILDREN UNDER 6 YEARS
0.6/ 100
METRIC RATING
255th/ 347
METRIC RANK
8.0%
UNEMPLOYMENT AMONG WOMEN WITH CHILDREN UNDER 6 YEARS
4.1/ 100
METRIC RATING
237th/ 347
METRIC RANK
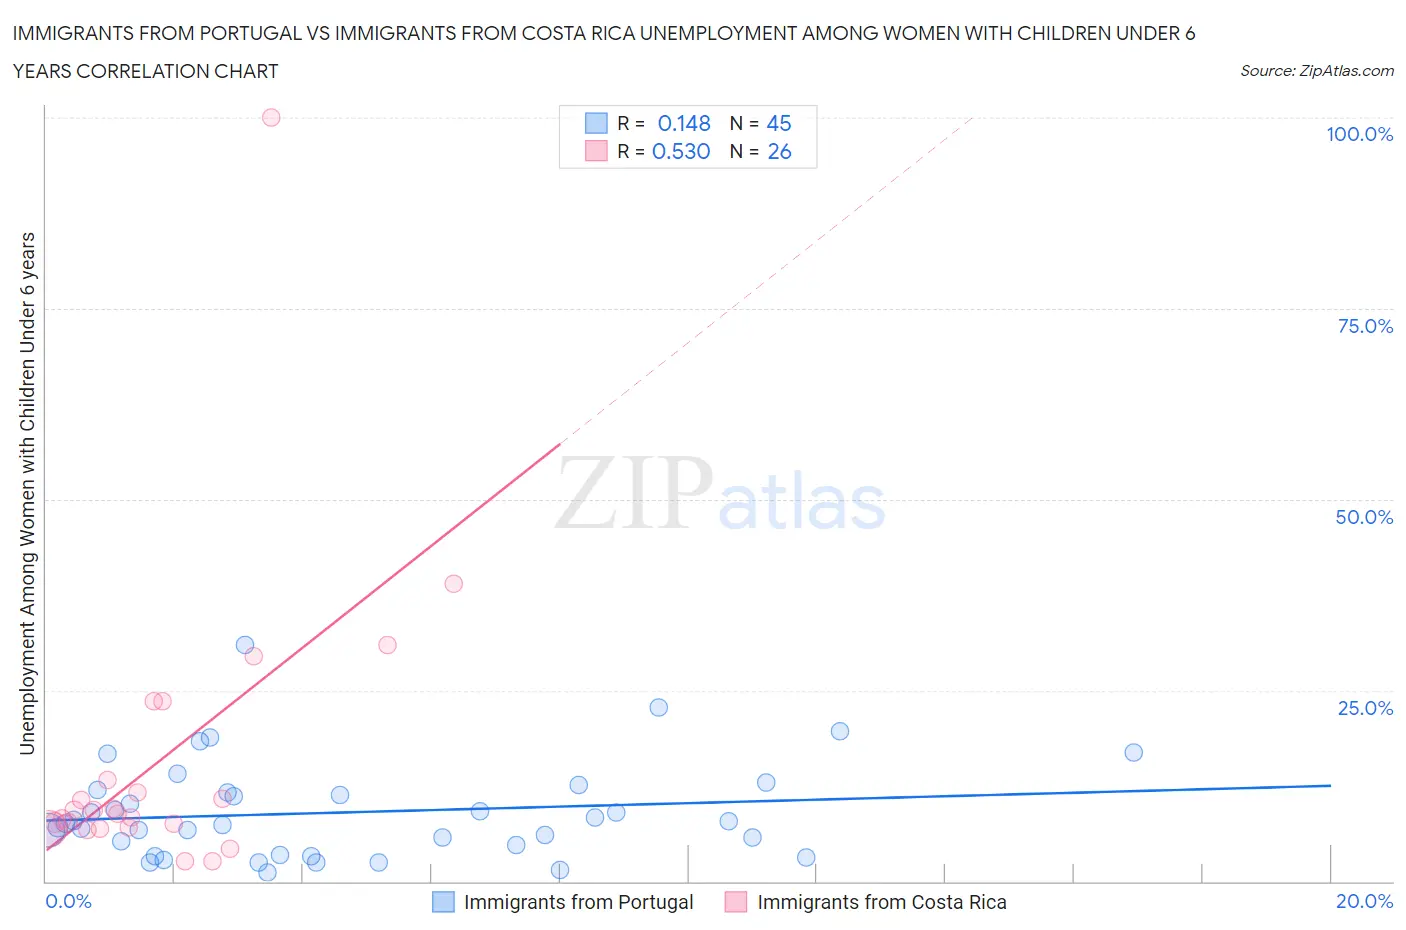
Immigrants from Portugal vs Immigrants from Costa Rica Unemployment Among Women with Children Under 6 years Correlation Chart
The statistical analysis conducted on geographies consisting of 145,443,316 people shows a poor positive correlation between the proportion of Immigrants from Portugal and unemployment rate among women with children under the age of 6 in the United States with a correlation coefficient (R) of 0.148 and weighted average of 8.3%. Similarly, the statistical analysis conducted on geographies consisting of 174,865,602 people shows a substantial positive correlation between the proportion of Immigrants from Costa Rica and unemployment rate among women with children under the age of 6 in the United States with a correlation coefficient (R) of 0.530 and weighted average of 8.0%, a difference of 3.1%.
Unemployment Among Women with Children Under 6 years Correlation Summary
| Measurement | Immigrants from Portugal | Immigrants from Costa Rica |
| Minimum | 1.2% | 2.6% |
| Maximum | 31.0% | 100.0% |
| Range | 29.8% | 97.4% |
| Mean | 9.0% | 15.6% |
| Median | 7.5% | 9.1% |
| Interquartile 25% (IQ1) | 4.1% | 7.1% |
| Interquartile 75% (IQ3) | 11.8% | 13.2% |
| Interquartile Range (IQR) | 7.7% | 6.1% |
| Standard Deviation (Sample) | 6.3% | 19.5% |
| Standard Deviation (Population) | 6.2% | 19.1% |
Demographics Similar to Immigrants from Portugal and Immigrants from Costa Rica by Unemployment Among Women with Children Under 6 years
In terms of unemployment among women with children under 6 years, the demographic groups most similar to Immigrants from Portugal are Celtic (8.3%, a difference of 0.020%), Immigrants from Caribbean (8.3%, a difference of 0.29%), Immigrants from Guyana (8.2%, a difference of 0.56%), Guyanese (8.2%, a difference of 0.74%), and Ghanaian (8.2%, a difference of 0.74%). Similarly, the demographic groups most similar to Immigrants from Costa Rica are Immigrants from Barbados (8.0%, a difference of 0.060%), Immigrants from Middle Africa (8.1%, a difference of 0.38%), Irish (8.1%, a difference of 0.65%), Immigrants from El Salvador (8.1%, a difference of 0.72%), and Liberian (8.1%, a difference of 0.74%).
| Demographics | Rating | Rank | Unemployment Among Women with Children Under 6 years |
| Immigrants | Barbados | 4.2 /100 | #236 | Tragic 8.0% |
| Immigrants | Costa Rica | 4.1 /100 | #237 | Tragic 8.0% |
| Immigrants | Middle Africa | 3.2 /100 | #238 | Tragic 8.1% |
| Irish | 2.7 /100 | #239 | Tragic 8.1% |
| Immigrants | El Salvador | 2.6 /100 | #240 | Tragic 8.1% |
| Liberians | 2.6 /100 | #241 | Tragic 8.1% |
| Dutch | 2.5 /100 | #242 | Tragic 8.1% |
| Hawaiians | 1.8 /100 | #243 | Tragic 8.2% |
| French | 1.7 /100 | #244 | Tragic 8.2% |
| Native Hawaiians | 1.7 /100 | #245 | Tragic 8.2% |
| Central Americans | 1.4 /100 | #246 | Tragic 8.2% |
| German Russians | 1.2 /100 | #247 | Tragic 8.2% |
| Immigrants | Western Africa | 1.1 /100 | #248 | Tragic 8.2% |
| Immigrants | Sierra Leone | 1.1 /100 | #249 | Tragic 8.2% |
| Nigerians | 1.1 /100 | #250 | Tragic 8.2% |
| Guyanese | 1.0 /100 | #251 | Tragic 8.2% |
| Ghanaians | 1.0 /100 | #252 | Tragic 8.2% |
| Immigrants | Guyana | 0.8 /100 | #253 | Tragic 8.2% |
| Immigrants | Caribbean | 0.7 /100 | #254 | Tragic 8.3% |
| Immigrants | Portugal | 0.6 /100 | #255 | Tragic 8.3% |
| Celtics | 0.6 /100 | #256 | Tragic 8.3% |