Immigrants from Poland vs Native/Alaskan Unemployment Among Ages 35 to 44 years

COMPARE

Immigrants from Poland
Race
Ancestry
AfghanAfricanAlaska NativeAlaskan AthabascanAlbanianAleutAlsatianAmericanApacheArabArapahoArgentineanArmenianAssyrian/Chaldean/SyriacAustralianAustrianBahamianBangladeshiBarbadianBasqueBelgianBelizeanBermudanBhutaneseBlackfeetBolivianBrazilianBritishBritish West IndianBulgarianBurmeseCajunCambodianCanadianCape VerdeanCarpatho RusynCelticCentral AmericanCentral American IndianCherokeeCheyenneChickasawChileanChineseChippewaChoctawColombianColvilleComancheCosta RicanCreeCreekCroatianCrowCubanCypriotCzechCzechoslovakianDanishDelawareDominicanDutchDutch West IndianEastern EuropeanEcuadorianEgyptianEnglishEstonianEthiopianEuropeanFijianFilipinoFinnishFrenchFrench American IndianFrench CanadianGermanGerman RussianGhanaianGreekGuamanian/ChamorroGuatemalanGuyaneseHaitianHmongHonduranHopiHoumaHungarianIcelanderIndian (Asian)IndonesianInupiatIranianIraqiIrishIroquoisIsraeliItalianJamaicanJapaneseJordanianKenyanKiowaKoreanLaotianLatvianLebaneseLiberianLithuanianLumbeeLuxembourgerMacedonianMalaysianMalteseMarshalleseMenomineeMexicanMexican American IndianMongolianMoroccanNative HawaiianNavajoNepaleseNew ZealanderNicaraguanNigerianNorthern EuropeanNorwegianOkinawanOsageOttawaPaiutePakistaniPalestinianPanamanianParaguayanPennsylvania GermanPeruvianPimaPolishPortuguesePotawatomiPuebloPuerto RicanPuget Sound SalishRomanianRussianSalvadoranSamoanScandinavianScotch-IrishScottishSeminoleSenegaleseSerbianShoshoneSierra LeoneanSiouxSlavicSlovakSloveneSomaliSouth AfricanSouth AmericanSouth American IndianSoviet UnionSpaniardSpanishSpanish AmericanSpanish American IndianSri LankanSubsaharan AfricanSudaneseSwedishSwissSyrianTaiwaneseThaiTlingit-HaidaTohono O'OdhamTonganTrinidadian and TobagonianTsimshianTurkishU.S. Virgin IslanderUgandanUkrainianUruguayanUteVenezuelanVietnameseWelshWest IndianYakamaYaquiYugoslavianYumanYup'ikZimbabwean
Immigration
NonimmigrantsImmigrantsAfghanistanAfricaAlbaniaArgentinaArmeniaAsiaAustraliaAustriaBahamasBangladeshBarbadosBelarusBelgiumBelizeBoliviaBosnia and HerzegovinaBrazilBulgariaBurma/MyanmarCabo VerdeCambodiaCameroonCanadaCaribbeanCentral AmericaChileChinaColombiaCongoCosta RicaCroatiaCubaCzechoslovakiaDenmarkDominicaDominican RepublicEastern AfricaEastern AsiaEastern EuropeEcuadorEgyptEl SalvadorEnglandEritreaEthiopiaEuropeFijiFranceGermanyGhanaGreeceGrenadaGuatemalaGuyanaHaitiHondurasHong KongHungaryIndiaIndonesiaIranIraqIrelandIsraelItalyJamaicaJapanJordanKazakhstanKenyaKoreaKuwaitLaosLatin AmericaLatviaLebanonLiberiaLithuaniaMalaysiaMexicoMicronesiaMiddle AfricaMoldovaMoroccoNepalNetherlandsNicaraguaNigeriaNorth AmericaNorth MacedoniaNorthern AfricaNorthern EuropeNorwayOceaniaPakistanPanamaPeruPhilippinesPolandPortugalRomaniaRussiaSaudi ArabiaScotlandSenegalSerbiaSierra LeoneSingaporeSomaliaSouth AfricaSouth AmericaSouth Central AsiaSouth Eastern AsiaSouthern EuropeSpainSri LankaSt. Vincent and the GrenadinesSudanSwedenSwitzerlandSyriaTaiwanThailandTrinidad and TobagoTurkeyUgandaUkraineUruguayUzbekistanVenezuelaVietnamWest IndiesWestern AfricaWestern AsiaWestern EuropeYemenZaireZimbabweAzores
Native/Alaskan
Race
Ancestry
AfghanAfricanAlaska NativeAlaskan AthabascanAlbanianAleutAlsatianAmericanApacheArabArapahoArgentineanArmenianAssyrian/Chaldean/SyriacAustralianAustrianBahamianBangladeshiBarbadianBasqueBelgianBelizeanBermudanBhutaneseBlackfeetBolivianBrazilianBritishBritish West IndianBulgarianBurmeseCajunCambodianCanadianCape VerdeanCarpatho RusynCelticCentral AmericanCentral American IndianCherokeeCheyenneChickasawChileanChineseChippewaChoctawColombianColvilleComancheCosta RicanCreeCreekCroatianCrowCubanCypriotCzechCzechoslovakianDanishDelawareDominicanDutchDutch West IndianEastern EuropeanEcuadorianEgyptianEnglishEstonianEthiopianEuropeanFijianFilipinoFinnishFrenchFrench American IndianFrench CanadianGermanGerman RussianGhanaianGreekGuamanian/ChamorroGuatemalanGuyaneseHaitianHmongHonduranHopiHoumaHungarianIcelanderIndian (Asian)IndonesianInupiatIranianIraqiIrishIroquoisIsraeliItalianJamaicanJapaneseJordanianKenyanKiowaKoreanLaotianLatvianLebaneseLiberianLithuanianLumbeeLuxembourgerMacedonianMalaysianMalteseMarshalleseMenomineeMexicanMexican American IndianMongolianMoroccanNative HawaiianNavajoNepaleseNew ZealanderNicaraguanNigerianNorthern EuropeanNorwegianOkinawanOsageOttawaPaiutePakistaniPalestinianPanamanianParaguayanPennsylvania GermanPeruvianPimaPolishPortuguesePotawatomiPuebloPuerto RicanPuget Sound SalishRomanianRussianSalvadoranSamoanScandinavianScotch-IrishScottishSeminoleSenegaleseSerbianShoshoneSierra LeoneanSiouxSlavicSlovakSloveneSomaliSouth AfricanSouth AmericanSouth American IndianSoviet UnionSpaniardSpanishSpanish AmericanSpanish American IndianSri LankanSubsaharan AfricanSudaneseSwedishSwissSyrianTaiwaneseThaiTlingit-HaidaTohono O'OdhamTonganTrinidadian and TobagonianTsimshianTurkishU.S. Virgin IslanderUgandanUkrainianUruguayanUteVenezuelanVietnameseWelshWest IndianYakamaYaquiYugoslavianYumanYup'ikZimbabwean
Immigration
NonimmigrantsImmigrantsAfghanistanAfricaAlbaniaArgentinaArmeniaAsiaAustraliaAustriaBahamasBangladeshBarbadosBelarusBelgiumBelizeBoliviaBosnia and HerzegovinaBrazilBulgariaBurma/MyanmarCabo VerdeCambodiaCameroonCanadaCaribbeanCentral AmericaChileChinaColombiaCongoCosta RicaCroatiaCubaCzechoslovakiaDenmarkDominicaDominican RepublicEastern AfricaEastern AsiaEastern EuropeEcuadorEgyptEl SalvadorEnglandEritreaEthiopiaEuropeFijiFranceGermanyGhanaGreeceGrenadaGuatemalaGuyanaHaitiHondurasHong KongHungaryIndiaIndonesiaIranIraqIrelandIsraelItalyJamaicaJapanJordanKazakhstanKenyaKoreaKuwaitLaosLatin AmericaLatviaLebanonLiberiaLithuaniaMalaysiaMexicoMicronesiaMiddle AfricaMoldovaMoroccoNepalNetherlandsNicaraguaNigeriaNorth AmericaNorth MacedoniaNorthern AfricaNorthern EuropeNorwayOceaniaPakistanPanamaPeruPhilippinesPortugalRomaniaRussiaSaudi ArabiaScotlandSenegalSerbiaSierra LeoneSingaporeSomaliaSouth AfricaSouth AmericaSouth Central AsiaSouth Eastern AsiaSouthern EuropeSpainSri LankaSt. Vincent and the GrenadinesSudanSwedenSwitzerlandSyriaTaiwanThailandTrinidad and TobagoTurkeyUgandaUkraineUruguayUzbekistanVenezuelaVietnamWest IndiesWestern AfricaWestern AsiaWestern EuropeYemenZaireZimbabweAzores
Unemployment Among Ages 35 to 44 years
Income
Poverty
Unemployment
Labor Participation
Family Structure
Vehicle Availability
Education Level
Disability

Unemployment Among Ages 35 to 44 years Comparison

Immigrants from Poland

Natives/Alaskans

Fair
Tragic
4.7%
UNEMPLOYMENT AMONG AGES 35 TO 44 YEARS
37.9/ 100
METRIC RATING
183rd/ 347
METRIC RANK
7.3%
UNEMPLOYMENT AMONG AGES 35 TO 44 YEARS
0.0/ 100
METRIC RATING
332nd/ 347
METRIC RANK

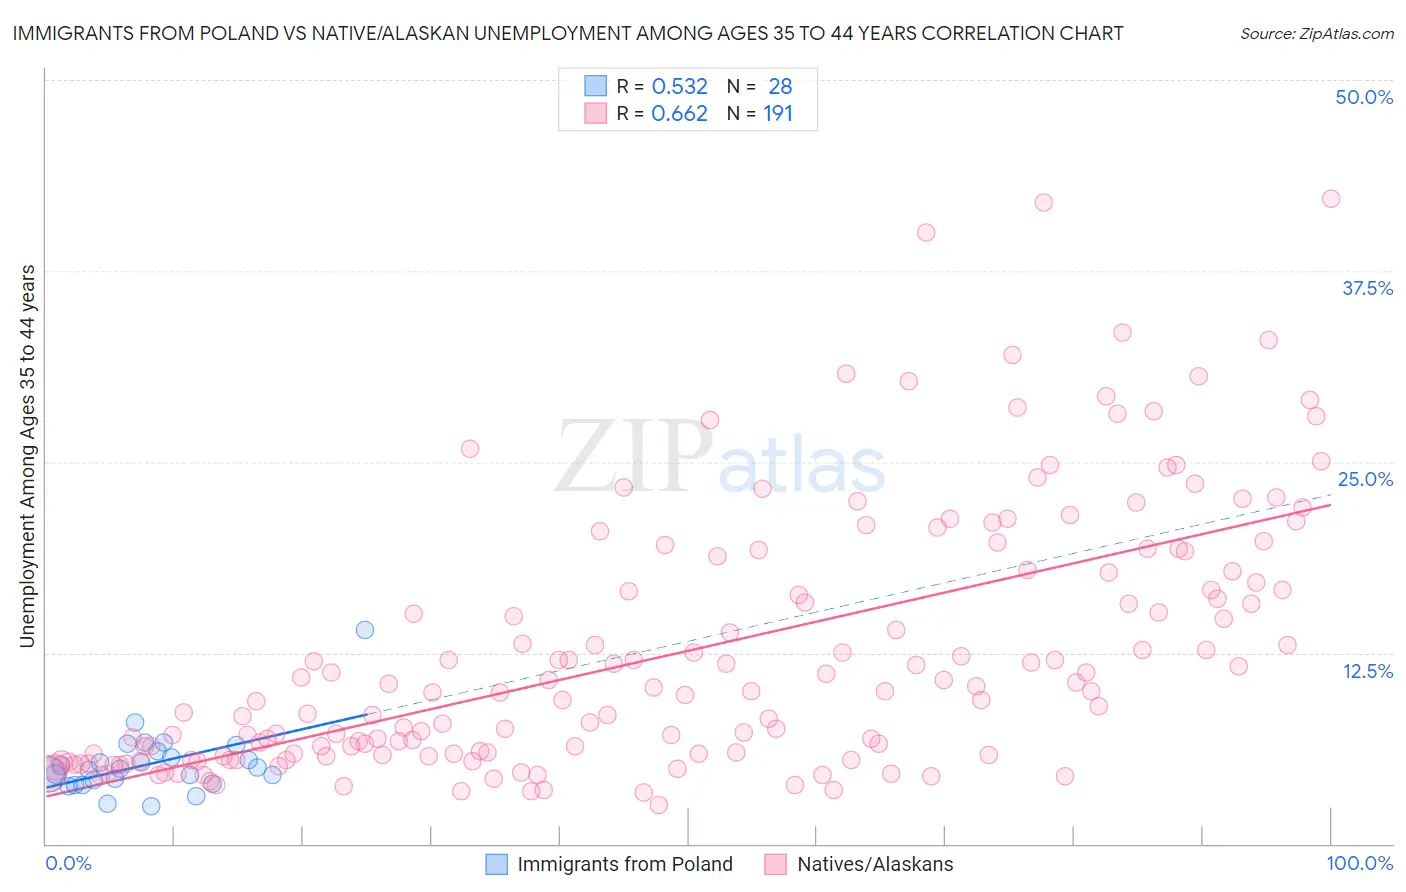
Immigrants from Poland vs Native/Alaskan Unemployment Among Ages 35 to 44 years Correlation Chart

The statistical analysis conducted on geographies consisting of 299,285,719 people shows a substantial positive correlation between the proportion of Immigrants from Poland and unemployment rate among population between the ages 35 and 44 in the United States with a correlation coefficient (R) of 0.532 and weighted average of 4.7%. Similarly, the statistical analysis conducted on geographies consisting of 490,779,782 people shows a significant positive correlation between the proportion of Natives/Alaskans and unemployment rate among population between the ages 35 and 44 in the United States with a correlation coefficient (R) of 0.662 and weighted average of 7.3%, a difference of 53.4%.
Immigrants from Poland vs Native/Alaskan Unemployment Among Ages 35 to 44 years

Unemployment Among Ages 35 to 44 years Correlation Summary

MeasurementImmigrants from PolandNative/Alaskan
Minimum2.4%2.5%
Maximum14.0%42.2%
Range11.6%39.7%
Mean5.2%12.6%
Median4.9%10.0%
Interquartile 25% (IQ1)4.0%5.8%
Interquartile 75% (IQ3)5.8%17.9%
Interquartile Range (IQR)1.8%12.0%
Standard Deviation (Sample)2.1%8.5%
Standard Deviation (Population)2.1%8.5%

Similar Demographics by Unemployment Among Ages 35 to 44 years

Demographics Similar to Immigrants from Poland by Unemployment Among Ages 35 to 44 years

In terms of unemployment among ages 35 to 44 years, the demographic groups most similar to Immigrants from Poland are Israeli (4.7%, a difference of 0.040%), Immigrants from Zaire (4.7%, a difference of 0.040%), Immigrants from Costa Rica (4.7%, a difference of 0.070%), Cypriot (4.7%, a difference of 0.11%), and Brazilian (4.7%, a difference of 0.12%).
DemographicsRating | RankUnemployment Among Ages 35 to 44 years
Immigrants | Uganda
48.1
/100
|
#176
Average
4.7%
Slovaks
44.6
/100
|
#177
Average
4.7%
South American Indians
40.7
/100
|
#178
Average
4.7%
Immigrants | South Eastern Asia
40.2
/100
|
#179
Average
4.7%
Immigrants | Peru
39.9
/100
|
#180
Fair
4.7%
Brazilians
39.5
/100
|
#181
Fair
4.7%
Israelis
38.5
/100
|
#182
Fair
4.7%
Immigrants | Poland
37.9
/100
|
#183
Fair
4.7%
Immigrants | Zaire
37.3
/100
|
#184
Fair
4.7%
Immigrants | Costa Rica
37.0
/100
|
#185
Fair
4.7%
Cypriots
36.5
/100
|
#186
Fair
4.7%
Malaysians
35.5
/100
|
#187
Fair
4.7%
Immigrants | Laos
34.5
/100
|
#188
Fair
4.7%
Immigrants | Congo
33.9
/100
|
#189
Fair
4.7%
Immigrants | Southern Europe
33.8
/100
|
#190
Fair
4.7%

Demographics Similar to Natives/Alaskans by Unemployment Among Ages 35 to 44 years

In terms of unemployment among ages 35 to 44 years, the demographic groups most similar to Natives/Alaskans are Pueblo (7.1%, a difference of 2.9%), Puerto Rican (7.6%, a difference of 5.2%), Immigrants from Cabo Verde (6.9%, a difference of 5.5%), Paiute (6.9%, a difference of 5.5%), and Houma (7.8%, a difference of 8.0%).
DemographicsRating | RankUnemployment Among Ages 35 to 44 years
Immigrants | Yemen
0.0
/100
|
#325
Tragic
6.6%
Alaska Natives
0.0
/100
|
#326
Tragic
6.6%
Cape Verdeans
0.0
/100
|
#327
Tragic
6.6%
Shoshone
0.0
/100
|
#328
Tragic
6.6%
Paiute
0.0
/100
|
#329
Tragic
6.9%
Immigrants | Cabo Verde
0.0
/100
|
#330
Tragic
6.9%
Pueblo
0.0
/100
|
#331
Tragic
7.1%
Natives/Alaskans
0.0
/100
|
#332
Tragic
7.3%
Puerto Ricans
0.0
/100
|
#333
Tragic
7.6%
Houma
0.0
/100
|
#334
Tragic
7.8%
Sioux
0.0
/100
|
#335
Tragic
8.4%
Apache
0.0
/100
|
#336
Tragic
8.4%
Tohono O'odham
0.0
/100
|
#337
Tragic
8.4%
Cheyenne
0.0
/100
|
#338
Tragic
8.5%
Inupiat
0.0
/100
|
#339
Tragic
8.6%