Immigrants from Philippines vs Sri Lankan Male Unemployment
COMPARE
Immigrants from Philippines
Sri Lankan
Male Unemployment
Male Unemployment Comparison
Immigrants from Philippines
Sri Lankans
5.4%
MALE UNEMPLOYMENT
13.5/ 100
METRIC RATING
201st/ 347
METRIC RANK
5.2%
MALE UNEMPLOYMENT
77.9/ 100
METRIC RATING
144th/ 347
METRIC RANK
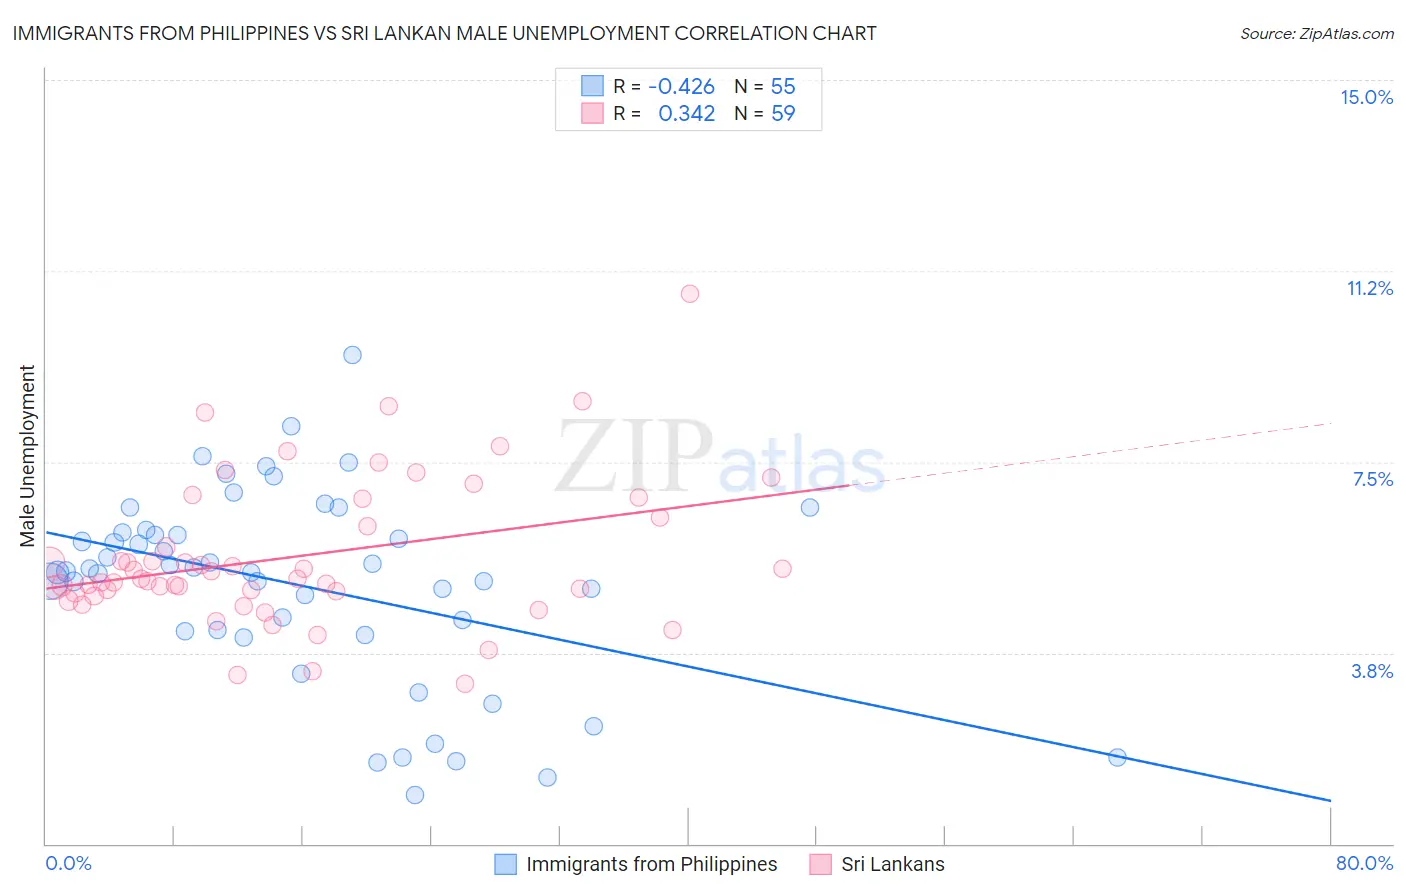
Immigrants from Philippines vs Sri Lankan Male Unemployment Correlation Chart
The statistical analysis conducted on geographies consisting of 468,596,641 people shows a moderate negative correlation between the proportion of Immigrants from Philippines and unemployment rate among males in the United States with a correlation coefficient (R) of -0.426 and weighted average of 5.4%. Similarly, the statistical analysis conducted on geographies consisting of 438,393,028 people shows a mild positive correlation between the proportion of Sri Lankans and unemployment rate among males in the United States with a correlation coefficient (R) of 0.342 and weighted average of 5.2%, a difference of 4.6%.
Male Unemployment Correlation Summary
| Measurement | Immigrants from Philippines | Sri Lankan |
| Minimum | 0.95% | 3.1% |
| Maximum | 9.6% | 10.8% |
| Range | 8.6% | 7.7% |
| Mean | 5.1% | 5.6% |
| Median | 5.3% | 5.2% |
| Interquartile 25% (IQ1) | 4.2% | 4.9% |
| Interquartile 75% (IQ3) | 6.1% | 6.4% |
| Interquartile Range (IQR) | 1.9% | 1.5% |
| Standard Deviation (Sample) | 1.9% | 1.4% |
| Standard Deviation (Population) | 1.9% | 1.4% |
Similar Demographics by Male Unemployment
Demographics Similar to Immigrants from Philippines by Male Unemployment
In terms of male unemployment, the demographic groups most similar to Immigrants from Philippines are Immigrants from Zaire (5.4%, a difference of 0.020%), Nonimmigrants (5.4%, a difference of 0.040%), Immigrants from Laos (5.4%, a difference of 0.050%), Immigrants from Greece (5.4%, a difference of 0.12%), and Immigrants from Thailand (5.4%, a difference of 0.15%).
| Demographics | Rating | Rank | Male Unemployment |
| Spanish | 19.7 /100 | #194 | Poor 5.4% |
| Immigrants | Southern Europe | 17.7 /100 | #195 | Poor 5.4% |
| Albanians | 17.3 /100 | #196 | Poor 5.4% |
| Alsatians | 16.7 /100 | #197 | Poor 5.4% |
| Immigrants | Thailand | 14.7 /100 | #198 | Poor 5.4% |
| Immigrants | Greece | 14.5 /100 | #199 | Poor 5.4% |
| Immigrants | Zaire | 13.7 /100 | #200 | Poor 5.4% |
| Immigrants | Philippines | 13.5 /100 | #201 | Poor 5.4% |
| Immigrants | Nonimmigrants | 13.1 /100 | #202 | Poor 5.4% |
| Immigrants | Laos | 13.0 /100 | #203 | Poor 5.4% |
| Guamanians/Chamorros | 12.3 /100 | #204 | Poor 5.4% |
| Immigrants | Costa Rica | 11.4 /100 | #205 | Poor 5.5% |
| Immigrants | Ukraine | 9.9 /100 | #206 | Tragic 5.5% |
| Immigrants | Syria | 9.3 /100 | #207 | Tragic 5.5% |
| Immigrants | Lebanon | 8.6 /100 | #208 | Tragic 5.5% |
Demographics Similar to Sri Lankans by Male Unemployment
In terms of male unemployment, the demographic groups most similar to Sri Lankans are Syrian (5.2%, a difference of 0.010%), Macedonian (5.2%, a difference of 0.010%), Immigrants from Kenya (5.2%, a difference of 0.020%), Fijian (5.2%, a difference of 0.030%), and Immigrants from Burma/Myanmar (5.2%, a difference of 0.030%).
| Demographics | Rating | Rank | Male Unemployment |
| Immigrants | Eastern Africa | 79.8 /100 | #137 | Good 5.2% |
| Immigrants | Croatia | 79.7 /100 | #138 | Good 5.2% |
| Kenyans | 79.4 /100 | #139 | Good 5.2% |
| Brazilians | 79.3 /100 | #140 | Good 5.2% |
| Immigrants | Switzerland | 79.2 /100 | #141 | Good 5.2% |
| Fijians | 78.3 /100 | #142 | Good 5.2% |
| Syrians | 78.0 /100 | #143 | Good 5.2% |
| Sri Lankans | 77.9 /100 | #144 | Good 5.2% |
| Macedonians | 77.7 /100 | #145 | Good 5.2% |
| Immigrants | Kenya | 77.6 /100 | #146 | Good 5.2% |
| Immigrants | Burma/Myanmar | 77.5 /100 | #147 | Good 5.2% |
| Immigrants | Italy | 76.3 /100 | #148 | Good 5.2% |
| Immigrants | Europe | 76.2 /100 | #149 | Good 5.2% |
| Indians (Asian) | 76.0 /100 | #150 | Good 5.2% |
| Slovaks | 75.5 /100 | #151 | Good 5.2% |