Immigrants from Philippines vs Immigrants from Kuwait Unemployment Among Ages 25 to 29 years
COMPARE
Immigrants from Philippines
Immigrants from Kuwait
Unemployment Among Ages 25 to 29 years
Unemployment Among Ages 25 to 29 years Comparison
Immigrants from Philippines
Immigrants from Kuwait
6.8%
UNEMPLOYMENT AMONG AGES 25 TO 29 YEARS
16.7/ 100
METRIC RATING
211th/ 347
METRIC RANK
5.9%
UNEMPLOYMENT AMONG AGES 25 TO 29 YEARS
99.9/ 100
METRIC RATING
14th/ 347
METRIC RANK
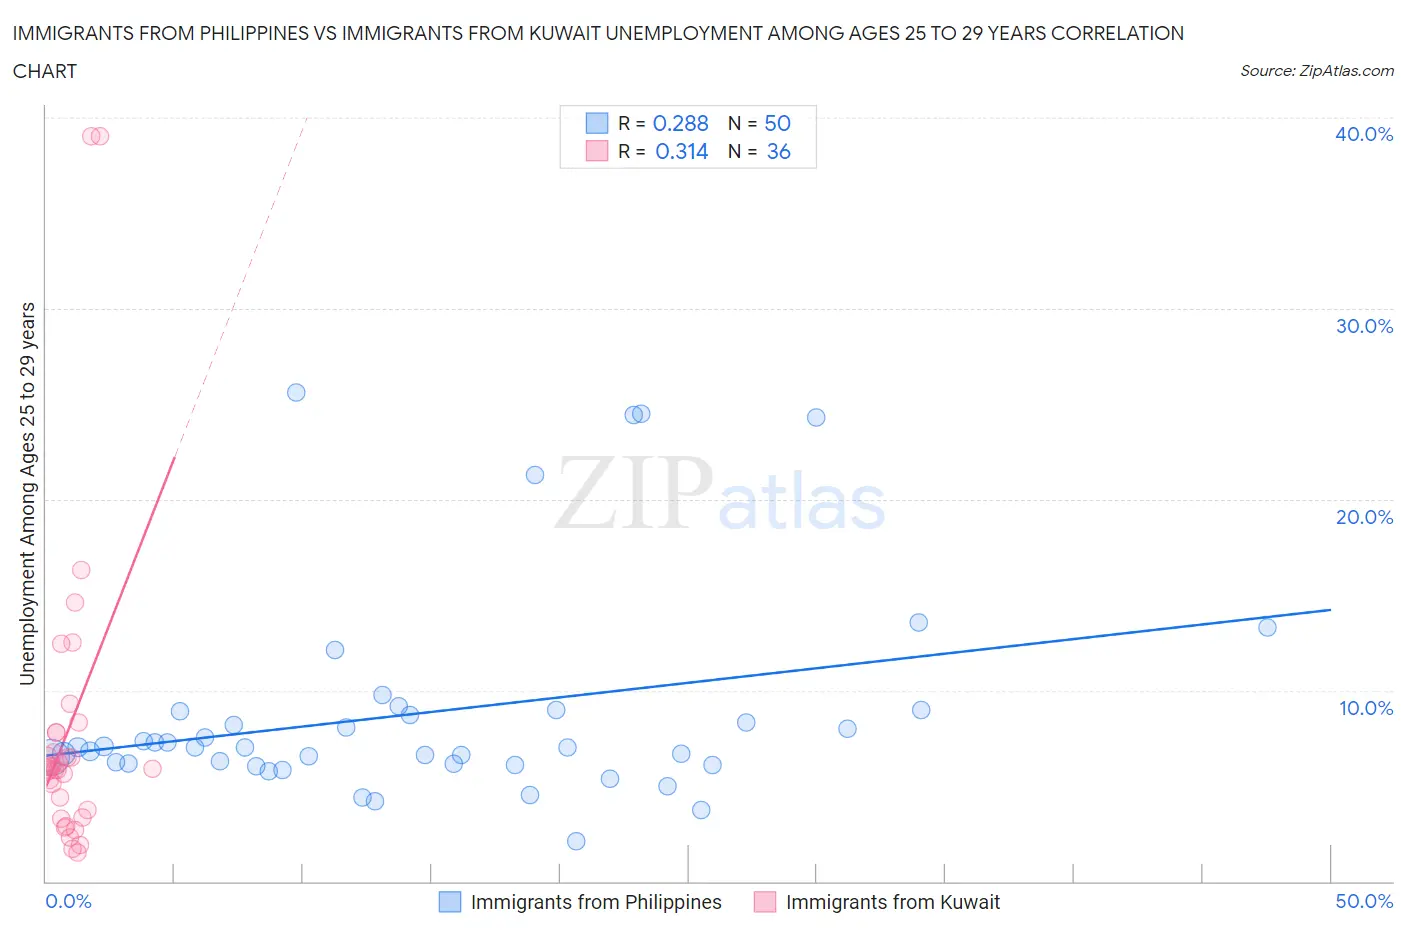
Immigrants from Philippines vs Immigrants from Kuwait Unemployment Among Ages 25 to 29 years Correlation Chart
The statistical analysis conducted on geographies consisting of 442,687,196 people shows a weak positive correlation between the proportion of Immigrants from Philippines and unemployment rate among population between the ages 25 and 29 in the United States with a correlation coefficient (R) of 0.288 and weighted average of 6.8%. Similarly, the statistical analysis conducted on geographies consisting of 135,474,180 people shows a mild positive correlation between the proportion of Immigrants from Kuwait and unemployment rate among population between the ages 25 and 29 in the United States with a correlation coefficient (R) of 0.314 and weighted average of 5.9%, a difference of 15.7%.
Unemployment Among Ages 25 to 29 years Correlation Summary
| Measurement | Immigrants from Philippines | Immigrants from Kuwait |
| Minimum | 2.1% | 1.5% |
| Maximum | 25.6% | 39.0% |
| Range | 23.5% | 37.5% |
| Mean | 8.8% | 8.0% |
| Median | 7.0% | 5.9% |
| Interquartile 25% (IQ1) | 6.2% | 3.5% |
| Interquartile 75% (IQ3) | 8.9% | 7.8% |
| Interquartile Range (IQR) | 2.7% | 4.3% |
| Standard Deviation (Sample) | 5.5% | 8.4% |
| Standard Deviation (Population) | 5.5% | 8.2% |
Similar Demographics by Unemployment Among Ages 25 to 29 years
Demographics Similar to Immigrants from Philippines by Unemployment Among Ages 25 to 29 years
In terms of unemployment among ages 25 to 29 years, the demographic groups most similar to Immigrants from Philippines are Canadian (6.8%, a difference of 0.030%), Hawaiian (6.8%, a difference of 0.050%), Immigrants from Cabo Verde (6.8%, a difference of 0.050%), Immigrants from Syria (6.8%, a difference of 0.17%), and Immigrants from Germany (6.8%, a difference of 0.23%).
| Demographics | Rating | Rank | Unemployment Among Ages 25 to 29 years |
| Scotch-Irish | 20.0 /100 | #204 | Poor 6.8% |
| Immigrants | England | 19.8 /100 | #205 | Poor 6.8% |
| Ugandans | 19.8 /100 | #206 | Poor 6.8% |
| Immigrants | Denmark | 19.0 /100 | #207 | Poor 6.8% |
| Immigrants | Germany | 18.8 /100 | #208 | Poor 6.8% |
| Hawaiians | 17.1 /100 | #209 | Poor 6.8% |
| Canadians | 16.9 /100 | #210 | Poor 6.8% |
| Immigrants | Philippines | 16.7 /100 | #211 | Poor 6.8% |
| Immigrants | Cabo Verde | 16.2 /100 | #212 | Poor 6.8% |
| Immigrants | Syria | 15.1 /100 | #213 | Poor 6.8% |
| Liberians | 14.7 /100 | #214 | Poor 6.8% |
| Spanish | 14.4 /100 | #215 | Poor 6.8% |
| Slovaks | 14.3 /100 | #216 | Poor 6.8% |
| Ute | 13.4 /100 | #217 | Poor 6.8% |
| Immigrants | Austria | 12.3 /100 | #218 | Poor 6.8% |
Demographics Similar to Immigrants from Kuwait by Unemployment Among Ages 25 to 29 years
In terms of unemployment among ages 25 to 29 years, the demographic groups most similar to Immigrants from Kuwait are Cuban (5.9%, a difference of 0.35%), Immigrants from Bulgaria (5.9%, a difference of 0.36%), Bolivian (5.9%, a difference of 0.50%), Immigrants from Singapore (5.9%, a difference of 0.61%), and Immigrants from Bolivia (5.9%, a difference of 0.63%).
| Demographics | Rating | Rank | Unemployment Among Ages 25 to 29 years |
| Immigrants | India | 100.0 /100 | #7 | Exceptional 5.7% |
| Immigrants | Bosnia and Herzegovina | 100.0 /100 | #8 | Exceptional 5.7% |
| Immigrants | Nepal | 100.0 /100 | #9 | Exceptional 5.7% |
| Immigrants | Sudan | 100.0 /100 | #10 | Exceptional 5.8% |
| Cambodians | 100.0 /100 | #11 | Exceptional 5.8% |
| Okinawans | 100.0 /100 | #12 | Exceptional 5.9% |
| Immigrants | Bolivia | 100.0 /100 | #13 | Exceptional 5.9% |
| Immigrants | Kuwait | 99.9 /100 | #14 | Exceptional 5.9% |
| Cubans | 99.9 /100 | #15 | Exceptional 5.9% |
| Immigrants | Bulgaria | 99.9 /100 | #16 | Exceptional 5.9% |
| Bolivians | 99.9 /100 | #17 | Exceptional 5.9% |
| Immigrants | Singapore | 99.9 /100 | #18 | Exceptional 5.9% |
| Thais | 99.9 /100 | #19 | Exceptional 5.9% |
| Immigrants | Eritrea | 99.9 /100 | #20 | Exceptional 5.9% |
| Immigrants | Ethiopia | 99.9 /100 | #21 | Exceptional 6.0% |