Immigrants from Peru vs Immigrants from Singapore Unemployment Among Ages 55 to 59 years

COMPARE

Immigrants from Peru
Race
Ancestry
AfghanAfricanAlaska NativeAlaskan AthabascanAlbanianAleutAlsatianAmericanApacheArabArapahoArgentineanArmenianAssyrian/Chaldean/SyriacAustralianAustrianBahamianBangladeshiBarbadianBasqueBelgianBelizeanBermudanBhutaneseBlackfeetBolivianBrazilianBritishBritish West IndianBulgarianBurmeseCajunCambodianCanadianCape VerdeanCarpatho RusynCelticCentral AmericanCentral American IndianCherokeeCheyenneChickasawChileanChineseChippewaChoctawColombianColvilleComancheCosta RicanCreeCreekCroatianCrowCubanCypriotCzechCzechoslovakianDanishDelawareDominicanDutchDutch West IndianEastern EuropeanEcuadorianEgyptianEnglishEstonianEthiopianEuropeanFijianFilipinoFinnishFrenchFrench American IndianFrench CanadianGermanGerman RussianGhanaianGreekGuamanian/ChamorroGuatemalanGuyaneseHaitianHmongHonduranHopiHoumaHungarianIcelanderIndian (Asian)IndonesianInupiatIranianIraqiIrishIroquoisIsraeliItalianJamaicanJapaneseJordanianKenyanKiowaKoreanLaotianLatvianLebaneseLiberianLithuanianLumbeeLuxembourgerMacedonianMalaysianMalteseMarshalleseMenomineeMexicanMexican American IndianMongolianMoroccanNative HawaiianNavajoNepaleseNew ZealanderNicaraguanNigerianNorthern EuropeanNorwegianOkinawanOsageOttawaPaiutePakistaniPalestinianPanamanianParaguayanPennsylvania GermanPeruvianPimaPolishPortuguesePotawatomiPuebloPuerto RicanPuget Sound SalishRomanianRussianSalvadoranSamoanScandinavianScotch-IrishScottishSeminoleSenegaleseSerbianShoshoneSierra LeoneanSiouxSlavicSlovakSloveneSomaliSouth AfricanSouth AmericanSouth American IndianSoviet UnionSpaniardSpanishSpanish AmericanSpanish American IndianSri LankanSubsaharan AfricanSudaneseSwedishSwissSyrianTaiwaneseThaiTlingit-HaidaTohono O'OdhamTonganTrinidadian and TobagonianTsimshianTurkishU.S. Virgin IslanderUgandanUkrainianUruguayanUteVenezuelanVietnameseWelshWest IndianYakamaYaquiYugoslavianYumanYup'ikZimbabwean
Immigration
NonimmigrantsImmigrantsAfghanistanAfricaAlbaniaArgentinaArmeniaAsiaAustraliaAustriaBahamasBangladeshBarbadosBelarusBelgiumBelizeBoliviaBosnia and HerzegovinaBrazilBulgariaBurma/MyanmarCabo VerdeCambodiaCameroonCanadaCaribbeanCentral AmericaChileChinaColombiaCongoCosta RicaCroatiaCubaCzechoslovakiaDenmarkDominicaDominican RepublicEastern AfricaEastern AsiaEastern EuropeEcuadorEgyptEl SalvadorEnglandEritreaEthiopiaEuropeFijiFranceGermanyGhanaGreeceGrenadaGuatemalaGuyanaHaitiHondurasHong KongHungaryIndiaIndonesiaIranIraqIrelandIsraelItalyJamaicaJapanJordanKazakhstanKenyaKoreaKuwaitLaosLatin AmericaLatviaLebanonLiberiaLithuaniaMalaysiaMexicoMicronesiaMiddle AfricaMoldovaMoroccoNepalNetherlandsNicaraguaNigeriaNorth AmericaNorth MacedoniaNorthern AfricaNorthern EuropeNorwayOceaniaPakistanPanamaPeruPhilippinesPolandPortugalRomaniaRussiaSaudi ArabiaScotlandSenegalSerbiaSierra LeoneSomaliaSouth AfricaSouth AmericaSouth Central AsiaSouth Eastern AsiaSouthern EuropeSpainSri LankaSt. Vincent and the GrenadinesSudanSwedenSwitzerlandSyriaTaiwanThailandTrinidad and TobagoTurkeyUgandaUkraineUruguayUzbekistanVenezuelaVietnamWest IndiesWestern AfricaWestern AsiaWestern EuropeYemenZaireZimbabweAzores
Immigrants from Singapore
Race
Ancestry
AfghanAfricanAlaska NativeAlaskan AthabascanAlbanianAleutAlsatianAmericanApacheArabArapahoArgentineanArmenianAssyrian/Chaldean/SyriacAustralianAustrianBahamianBangladeshiBarbadianBasqueBelgianBelizeanBermudanBhutaneseBlackfeetBolivianBrazilianBritishBritish West IndianBulgarianBurmeseCajunCambodianCanadianCape VerdeanCarpatho RusynCelticCentral AmericanCentral American IndianCherokeeCheyenneChickasawChileanChineseChippewaChoctawColombianColvilleComancheCosta RicanCreeCreekCroatianCrowCubanCypriotCzechCzechoslovakianDanishDelawareDominicanDutchDutch West IndianEastern EuropeanEcuadorianEgyptianEnglishEstonianEthiopianEuropeanFijianFilipinoFinnishFrenchFrench American IndianFrench CanadianGermanGerman RussianGhanaianGreekGuamanian/ChamorroGuatemalanGuyaneseHaitianHmongHonduranHopiHoumaHungarianIcelanderIndian (Asian)IndonesianInupiatIranianIraqiIrishIroquoisIsraeliItalianJamaicanJapaneseJordanianKenyanKiowaKoreanLaotianLatvianLebaneseLiberianLithuanianLumbeeLuxembourgerMacedonianMalaysianMalteseMarshalleseMenomineeMexicanMexican American IndianMongolianMoroccanNative HawaiianNavajoNepaleseNew ZealanderNicaraguanNigerianNorthern EuropeanNorwegianOkinawanOsageOttawaPaiutePakistaniPalestinianPanamanianParaguayanPennsylvania GermanPeruvianPimaPolishPortuguesePotawatomiPuebloPuerto RicanPuget Sound SalishRomanianRussianSalvadoranSamoanScandinavianScotch-IrishScottishSeminoleSenegaleseSerbianShoshoneSierra LeoneanSiouxSlavicSlovakSloveneSomaliSouth AfricanSouth AmericanSouth American IndianSoviet UnionSpaniardSpanishSpanish AmericanSpanish American IndianSri LankanSubsaharan AfricanSudaneseSwedishSwissSyrianTaiwaneseThaiTlingit-HaidaTohono O'OdhamTonganTrinidadian and TobagonianTsimshianTurkishU.S. Virgin IslanderUgandanUkrainianUruguayanUteVenezuelanVietnameseWelshWest IndianYakamaYaquiYugoslavianYumanYup'ikZimbabwean
Immigration
NonimmigrantsImmigrantsAfghanistanAfricaAlbaniaArgentinaArmeniaAsiaAustraliaAustriaBahamasBangladeshBarbadosBelarusBelgiumBelizeBoliviaBosnia and HerzegovinaBrazilBulgariaBurma/MyanmarCabo VerdeCambodiaCameroonCanadaCaribbeanCentral AmericaChileChinaColombiaCongoCosta RicaCroatiaCubaCzechoslovakiaDenmarkDominicaDominican RepublicEastern AfricaEastern AsiaEastern EuropeEcuadorEgyptEl SalvadorEnglandEritreaEthiopiaEuropeFijiFranceGermanyGhanaGreeceGrenadaGuatemalaGuyanaHaitiHondurasHong KongHungaryIndiaIndonesiaIranIraqIrelandIsraelItalyJamaicaJapanJordanKazakhstanKenyaKoreaKuwaitLaosLatin AmericaLatviaLebanonLiberiaLithuaniaMalaysiaMexicoMicronesiaMiddle AfricaMoldovaMoroccoNepalNetherlandsNicaraguaNigeriaNorth AmericaNorth MacedoniaNorthern AfricaNorthern EuropeNorwayOceaniaPakistanPanamaPhilippinesPolandPortugalRomaniaRussiaSaudi ArabiaScotlandSenegalSerbiaSierra LeoneSingaporeSomaliaSouth AfricaSouth AmericaSouth Central AsiaSouth Eastern AsiaSouthern EuropeSpainSri LankaSt. Vincent and the GrenadinesSudanSwedenSwitzerlandSyriaTaiwanThailandTrinidad and TobagoTurkeyUgandaUkraineUruguayUzbekistanVenezuelaVietnamWest IndiesWestern AfricaWestern AsiaWestern EuropeYemenZaireZimbabweAzores
Unemployment Among Ages 55 to 59 years
Income
Poverty
Unemployment
Labor Participation
Family Structure
Vehicle Availability
Education Level
Disability

Unemployment Among Ages 55 to 59 years Comparison

Immigrants from Peru

Immigrants from Singapore

Fair
Good
4.8%
UNEMPLOYMENT AMONG AGES 55 TO 59 YEARS
38.6/ 100
METRIC RATING
183rd/ 347
METRIC RANK
4.8%
UNEMPLOYMENT AMONG AGES 55 TO 59 YEARS
76.6/ 100
METRIC RATING
147th/ 347
METRIC RANK

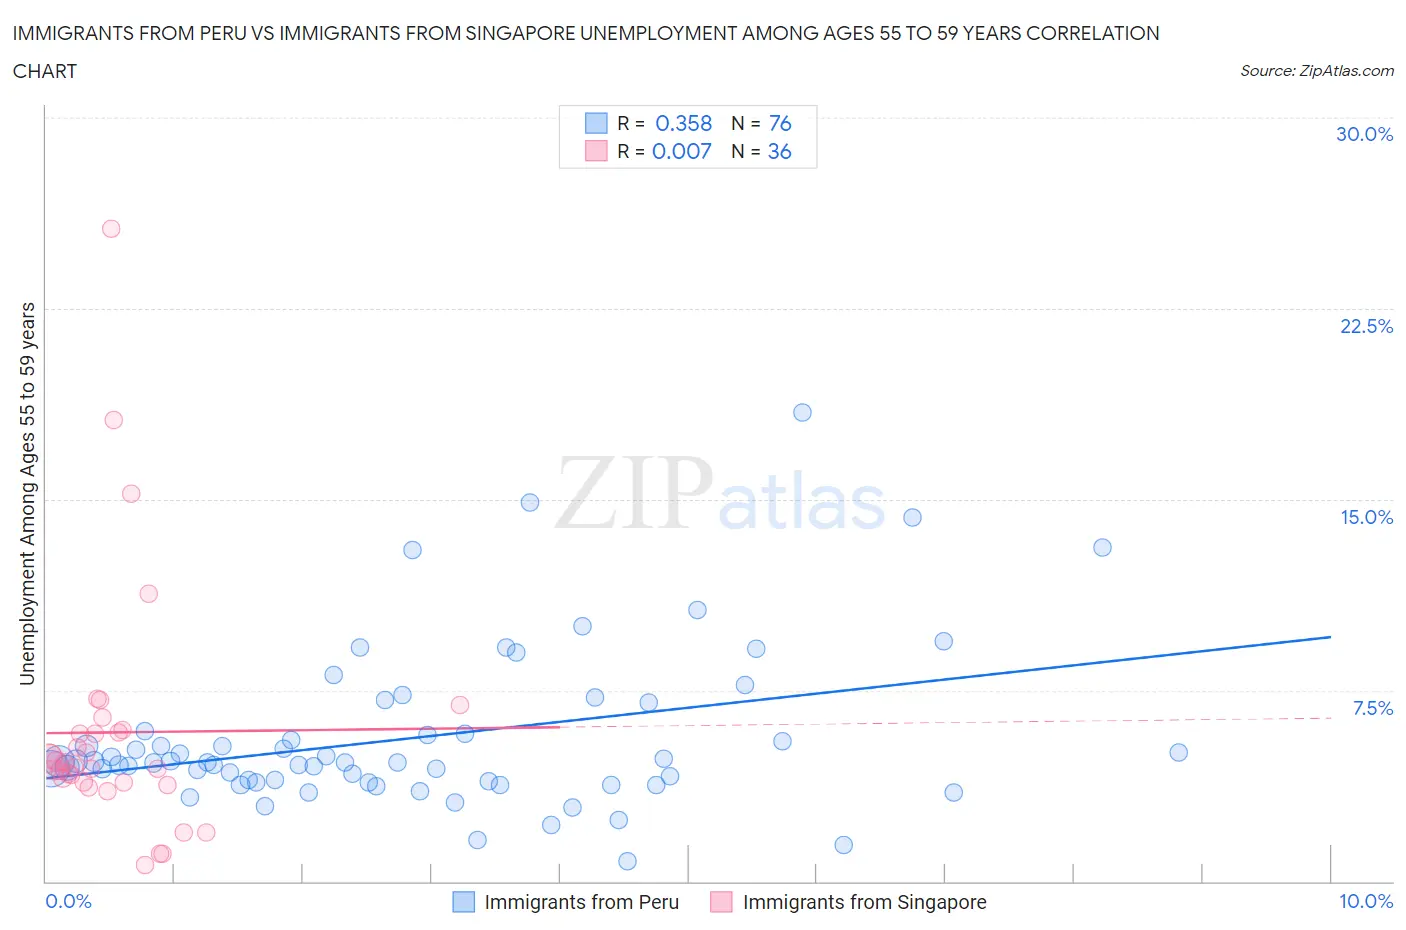
Immigrants from Peru vs Immigrants from Singapore Unemployment Among Ages 55 to 59 years Correlation Chart

The statistical analysis conducted on geographies consisting of 313,256,453 people shows a mild positive correlation between the proportion of Immigrants from Peru and unemployment rate among population between the ages 55 and 59 in the United States with a correlation coefficient (R) of 0.358 and weighted average of 4.8%. Similarly, the statistical analysis conducted on geographies consisting of 134,284,256 people shows no correlation between the proportion of Immigrants from Singapore and unemployment rate among population between the ages 55 and 59 in the United States with a correlation coefficient (R) of 0.007 and weighted average of 4.8%, a difference of 1.7%.
Immigrants from Peru vs Immigrants from Singapore Unemployment Among Ages 55 to 59 years

Unemployment Among Ages 55 to 59 years Correlation Summary

MeasurementImmigrants from PeruImmigrants from Singapore
Minimum0.80%0.62%
Maximum18.4%25.6%
Range17.6%25.0%
Mean5.6%5.9%
Median4.7%4.6%
Interquartile 25% (IQ1)3.9%3.9%
Interquartile 75% (IQ3)5.9%5.9%
Interquartile Range (IQR)1.9%2.0%
Standard Deviation (Sample)3.1%4.8%
Standard Deviation (Population)3.1%4.8%

Similar Demographics by Unemployment Among Ages 55 to 59 years

Demographics Similar to Immigrants from Peru by Unemployment Among Ages 55 to 59 years

In terms of unemployment among ages 55 to 59 years, the demographic groups most similar to Immigrants from Peru are Immigrants from Czechoslovakia (4.8%, a difference of 0.020%), Immigrants from Hungary (4.8%, a difference of 0.070%), Immigrants from Europe (4.8%, a difference of 0.070%), Peruvian (4.8%, a difference of 0.070%), and Osage (4.8%, a difference of 0.070%).
DemographicsRating | RankUnemployment Among Ages 55 to 59 years
Samoans
47.1
/100
|
#176
Average
4.8%
Immigrants | Sri Lanka
46.8
/100
|
#177
Average
4.8%
Arabs
44.7
/100
|
#178
Average
4.8%
Hungarians
44.3
/100
|
#179
Average
4.8%
South Americans
44.0
/100
|
#180
Average
4.8%
Immigrants | Hungary
40.4
/100
|
#181
Average
4.8%
Immigrants | Europe
40.4
/100
|
#182
Average
4.8%
Immigrants | Peru
38.6
/100
|
#183
Fair
4.8%
Immigrants | Czechoslovakia
38.0
/100
|
#184
Fair
4.8%
Peruvians
37.0
/100
|
#185
Fair
4.8%
Osage
37.0
/100
|
#186
Fair
4.8%
Immigrants | Morocco
36.5
/100
|
#187
Fair
4.8%
Immigrants | Eastern Asia
36.1
/100
|
#188
Fair
4.8%
Iroquois
34.5
/100
|
#189
Fair
4.9%
Russians
33.9
/100
|
#190
Fair
4.9%

Demographics Similar to Immigrants from Singapore by Unemployment Among Ages 55 to 59 years

In terms of unemployment among ages 55 to 59 years, the demographic groups most similar to Immigrants from Singapore are Immigrants from South Eastern Asia (4.8%, a difference of 0.050%), Immigrants from Northern Europe (4.8%, a difference of 0.060%), Immigrants from Asia (4.8%, a difference of 0.070%), Ukrainian (4.8%, a difference of 0.12%), and Immigrants from Norway (4.8%, a difference of 0.19%).
DemographicsRating | RankUnemployment Among Ages 55 to 59 years
Immigrants | Indonesia
80.2
/100
|
#140
Excellent
4.8%
French Canadians
80.1
/100
|
#141
Excellent
4.8%
Immigrants | Norway
79.8
/100
|
#142
Good
4.8%
Ukrainians
78.6
/100
|
#143
Good
4.8%
Immigrants | Asia
77.8
/100
|
#144
Good
4.8%
Immigrants | Northern Europe
77.5
/100
|
#145
Good
4.8%
Immigrants | South Eastern Asia
77.4
/100
|
#146
Good
4.8%
Immigrants | Singapore
76.6
/100
|
#147
Good
4.8%
Immigrants | Bahamas
71.8
/100
|
#148
Good
4.8%
Immigrants | Lithuania
70.8
/100
|
#149
Good
4.8%
Immigrants | Northern Africa
69.8
/100
|
#150
Good
4.8%
Bahamians
68.6
/100
|
#151
Good
4.8%
Laotians
68.2
/100
|
#152
Good
4.8%
Immigrants | Uruguay
67.2
/100
|
#153
Good
4.8%
Immigrants | Panama
66.8
/100
|
#154
Good
4.8%