Immigrants from Peru vs Immigrants from Cuba Unemployment Among Ages 45 to 54 years
COMPARE
Immigrants from Peru
Immigrants from Cuba
Unemployment Among Ages 45 to 54 years
Unemployment Among Ages 45 to 54 years Comparison
Immigrants from Peru
Immigrants from Cuba
4.6%
UNEMPLOYMENT AMONG AGES 45 TO 54 YEARS
19.1/ 100
METRIC RATING
202nd/ 347
METRIC RANK
3.9%
UNEMPLOYMENT AMONG AGES 45 TO 54 YEARS
100.0/ 100
METRIC RATING
6th/ 347
METRIC RANK
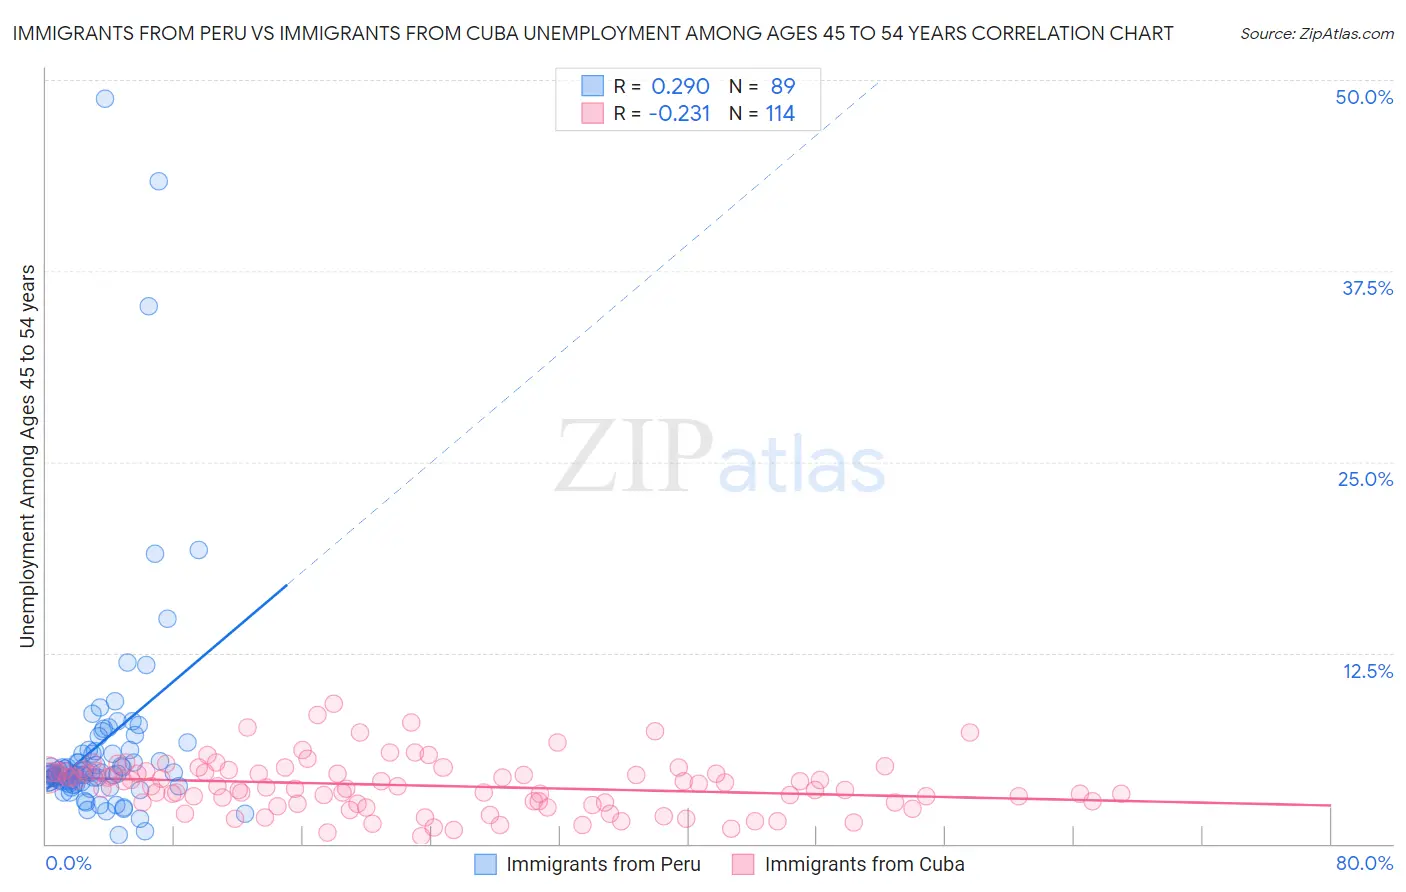
Immigrants from Peru vs Immigrants from Cuba Unemployment Among Ages 45 to 54 years Correlation Chart
The statistical analysis conducted on geographies consisting of 323,495,452 people shows a weak positive correlation between the proportion of Immigrants from Peru and unemployment rate among population between the ages 45 and 54 in the United States with a correlation coefficient (R) of 0.290 and weighted average of 4.6%. Similarly, the statistical analysis conducted on geographies consisting of 319,861,870 people shows a weak negative correlation between the proportion of Immigrants from Cuba and unemployment rate among population between the ages 45 and 54 in the United States with a correlation coefficient (R) of -0.231 and weighted average of 3.9%, a difference of 17.9%.
Unemployment Among Ages 45 to 54 years Correlation Summary
| Measurement | Immigrants from Peru | Immigrants from Cuba |
| Minimum | 0.60% | 0.50% |
| Maximum | 48.8% | 9.2% |
| Range | 48.2% | 8.7% |
| Mean | 6.6% | 3.8% |
| Median | 4.6% | 3.8% |
| Interquartile 25% (IQ1) | 4.0% | 2.7% |
| Interquartile 75% (IQ3) | 6.1% | 4.7% |
| Interquartile Range (IQR) | 2.1% | 2.1% |
| Standard Deviation (Sample) | 7.5% | 1.7% |
| Standard Deviation (Population) | 7.4% | 1.7% |
Similar Demographics by Unemployment Among Ages 45 to 54 years
Demographics Similar to Immigrants from Peru by Unemployment Among Ages 45 to 54 years
In terms of unemployment among ages 45 to 54 years, the demographic groups most similar to Immigrants from Peru are Liberian (4.6%, a difference of 0.030%), Immigrants from Costa Rica (4.6%, a difference of 0.040%), Immigrants from Denmark (4.6%, a difference of 0.060%), Brazilian (4.6%, a difference of 0.070%), and Immigrants from Morocco (4.6%, a difference of 0.18%).
| Demographics | Rating | Rank | Unemployment Among Ages 45 to 54 years |
| Peruvians | 31.5 /100 | #195 | Fair 4.6% |
| Estonians | 31.2 /100 | #196 | Fair 4.6% |
| Albanians | 31.1 /100 | #197 | Fair 4.6% |
| Immigrants | Belarus | 30.6 /100 | #198 | Fair 4.6% |
| Brazilians | 20.1 /100 | #199 | Fair 4.6% |
| Immigrants | Denmark | 19.8 /100 | #200 | Poor 4.6% |
| Immigrants | Costa Rica | 19.7 /100 | #201 | Poor 4.6% |
| Immigrants | Peru | 19.1 /100 | #202 | Poor 4.6% |
| Liberians | 18.7 /100 | #203 | Poor 4.6% |
| Immigrants | Morocco | 16.8 /100 | #204 | Poor 4.6% |
| Immigrants | Greece | 16.2 /100 | #205 | Poor 4.6% |
| Immigrants | Switzerland | 14.0 /100 | #206 | Poor 4.6% |
| Arabs | 13.7 /100 | #207 | Poor 4.6% |
| Immigrants | Africa | 13.6 /100 | #208 | Poor 4.6% |
| Immigrants | Nigeria | 13.3 /100 | #209 | Poor 4.6% |
Demographics Similar to Immigrants from Cuba by Unemployment Among Ages 45 to 54 years
In terms of unemployment among ages 45 to 54 years, the demographic groups most similar to Immigrants from Cuba are Danish (3.9%, a difference of 0.22%), Immigrants from India (3.9%, a difference of 0.39%), Immigrants from Venezuela (3.9%, a difference of 1.2%), Norwegian (3.9%, a difference of 1.3%), and Chinese (4.0%, a difference of 1.6%).
| Demographics | Rating | Rank | Unemployment Among Ages 45 to 54 years |
| Hmong | 100.0 /100 | #1 | Exceptional 3.7% |
| Fijians | 100.0 /100 | #2 | Exceptional 3.8% |
| Norwegians | 100.0 /100 | #3 | Exceptional 3.9% |
| Immigrants | India | 100.0 /100 | #4 | Exceptional 3.9% |
| Danes | 100.0 /100 | #5 | Exceptional 3.9% |
| Immigrants | Cuba | 100.0 /100 | #6 | Exceptional 3.9% |
| Immigrants | Venezuela | 100.0 /100 | #7 | Exceptional 3.9% |
| Chinese | 100.0 /100 | #8 | Exceptional 4.0% |
| Czechs | 100.0 /100 | #9 | Exceptional 4.0% |
| Venezuelans | 100.0 /100 | #10 | Exceptional 4.0% |
| Scandinavians | 100.0 /100 | #11 | Exceptional 4.0% |
| Swedes | 100.0 /100 | #12 | Exceptional 4.0% |
| Cubans | 100.0 /100 | #13 | Exceptional 4.0% |
| Immigrants | Bosnia and Herzegovina | 100.0 /100 | #14 | Exceptional 4.0% |
| Immigrants | Bolivia | 100.0 /100 | #15 | Exceptional 4.0% |