Immigrants from Panama vs Cheyenne Unemployment Among Ages 60 to 64 years
COMPARE
Immigrants from Panama
Cheyenne
Unemployment Among Ages 60 to 64 years
Unemployment Among Ages 60 to 64 years Comparison
Immigrants from Panama
Cheyenne
4.8%
UNEMPLOYMENT AMONG AGES 60 TO 64 YEARS
62.0/ 100
METRIC RATING
165th/ 347
METRIC RANK
5.6%
UNEMPLOYMENT AMONG AGES 60 TO 64 YEARS
0.0/ 100
METRIC RATING
316th/ 347
METRIC RANK
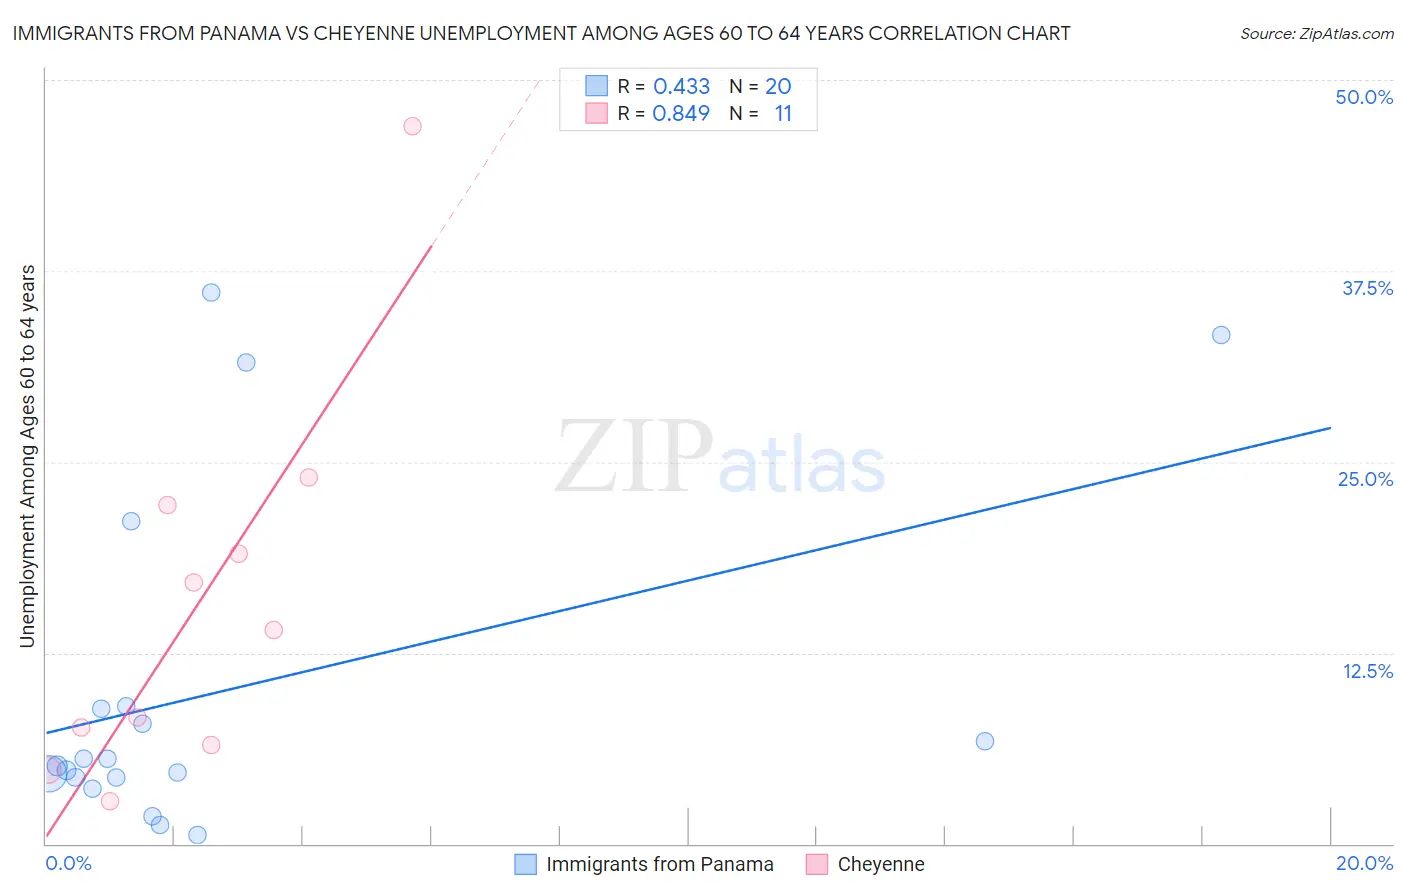
Immigrants from Panama vs Cheyenne Unemployment Among Ages 60 to 64 years Correlation Chart
The statistical analysis conducted on geographies consisting of 209,136,468 people shows a moderate positive correlation between the proportion of Immigrants from Panama and unemployment rate among population between the ages 60 and 64 in the United States with a correlation coefficient (R) of 0.433 and weighted average of 4.8%. Similarly, the statistical analysis conducted on geographies consisting of 77,275,074 people shows a very strong positive correlation between the proportion of Cheyenne and unemployment rate among population between the ages 60 and 64 in the United States with a correlation coefficient (R) of 0.849 and weighted average of 5.6%, a difference of 16.0%.
Unemployment Among Ages 60 to 64 years Correlation Summary
| Measurement | Immigrants from Panama | Cheyenne |
| Minimum | 0.60% | 2.8% |
| Maximum | 36.1% | 47.0% |
| Range | 35.5% | 44.2% |
| Mean | 10.0% | 15.7% |
| Median | 5.3% | 14.0% |
| Interquartile 25% (IQ1) | 4.4% | 6.5% |
| Interquartile 75% (IQ3) | 8.9% | 22.2% |
| Interquartile Range (IQR) | 4.6% | 15.7% |
| Standard Deviation (Sample) | 11.0% | 12.6% |
| Standard Deviation (Population) | 10.7% | 12.1% |
Similar Demographics by Unemployment Among Ages 60 to 64 years
Demographics Similar to Immigrants from Panama by Unemployment Among Ages 60 to 64 years
In terms of unemployment among ages 60 to 64 years, the demographic groups most similar to Immigrants from Panama are Palestinian (4.8%, a difference of 0.060%), Immigrants from Belgium (4.8%, a difference of 0.10%), Pakistani (4.8%, a difference of 0.10%), Immigrants from Northern Europe (4.8%, a difference of 0.11%), and Australian (4.8%, a difference of 0.12%).
| Demographics | Rating | Rank | Unemployment Among Ages 60 to 64 years |
| Immigrants | Taiwan | 66.0 /100 | #158 | Good 4.8% |
| Spanish | 65.5 /100 | #159 | Good 4.8% |
| Australians | 65.3 /100 | #160 | Good 4.8% |
| Immigrants | Norway | 65.1 /100 | #161 | Good 4.8% |
| South Africans | 65.1 /100 | #162 | Good 4.8% |
| Immigrants | Belgium | 64.8 /100 | #163 | Good 4.8% |
| Pakistanis | 64.6 /100 | #164 | Good 4.8% |
| Immigrants | Panama | 62.0 /100 | #165 | Good 4.8% |
| Palestinians | 60.5 /100 | #166 | Good 4.8% |
| Immigrants | Northern Europe | 59.1 /100 | #167 | Average 4.8% |
| Immigrants | Southern Europe | 56.7 /100 | #168 | Average 4.8% |
| Immigrants | France | 55.5 /100 | #169 | Average 4.8% |
| Immigrants | Korea | 54.2 /100 | #170 | Average 4.8% |
| Samoans | 53.6 /100 | #171 | Average 4.9% |
| Immigrants | Turkey | 52.8 /100 | #172 | Average 4.9% |
Demographics Similar to Cheyenne by Unemployment Among Ages 60 to 64 years
In terms of unemployment among ages 60 to 64 years, the demographic groups most similar to Cheyenne are Cree (5.6%, a difference of 0.36%), Shoshone (5.7%, a difference of 0.87%), Native/Alaskan (5.7%, a difference of 0.91%), Immigrants from Belize (5.7%, a difference of 1.4%), and Guyanese (5.5%, a difference of 1.7%).
| Demographics | Rating | Rank | Unemployment Among Ages 60 to 64 years |
| Soviet Union | 0.0 /100 | #309 | Tragic 5.4% |
| British West Indians | 0.0 /100 | #310 | Tragic 5.5% |
| U.S. Virgin Islanders | 0.0 /100 | #311 | Tragic 5.5% |
| Immigrants | West Indies | 0.0 /100 | #312 | Tragic 5.5% |
| Belizeans | 0.0 /100 | #313 | Tragic 5.5% |
| Guyanese | 0.0 /100 | #314 | Tragic 5.5% |
| Cree | 0.0 /100 | #315 | Tragic 5.6% |
| Cheyenne | 0.0 /100 | #316 | Tragic 5.6% |
| Shoshone | 0.0 /100 | #317 | Tragic 5.7% |
| Natives/Alaskans | 0.0 /100 | #318 | Tragic 5.7% |
| Immigrants | Belize | 0.0 /100 | #319 | Tragic 5.7% |
| Colville | 0.0 /100 | #320 | Tragic 5.7% |
| Dutch West Indians | 0.0 /100 | #321 | Tragic 5.7% |
| Ecuadorians | 0.0 /100 | #322 | Tragic 5.8% |
| Alsatians | 0.0 /100 | #323 | Tragic 5.8% |