Immigrants from Panama vs Central American Unemployment Among Seniors over 65 years
COMPARE
Immigrants from Panama
Central American
Unemployment Among Seniors over 65 years
Unemployment Among Seniors over 65 years Comparison
Immigrants from Panama
Central Americans
5.1%
UNEMPLOYMENT AMONG SENIORS OVER 65 YEARS
83.0/ 100
METRIC RATING
139th/ 347
METRIC RANK
5.5%
UNEMPLOYMENT AMONG SENIORS OVER 65 YEARS
0.0/ 100
METRIC RATING
285th/ 347
METRIC RANK
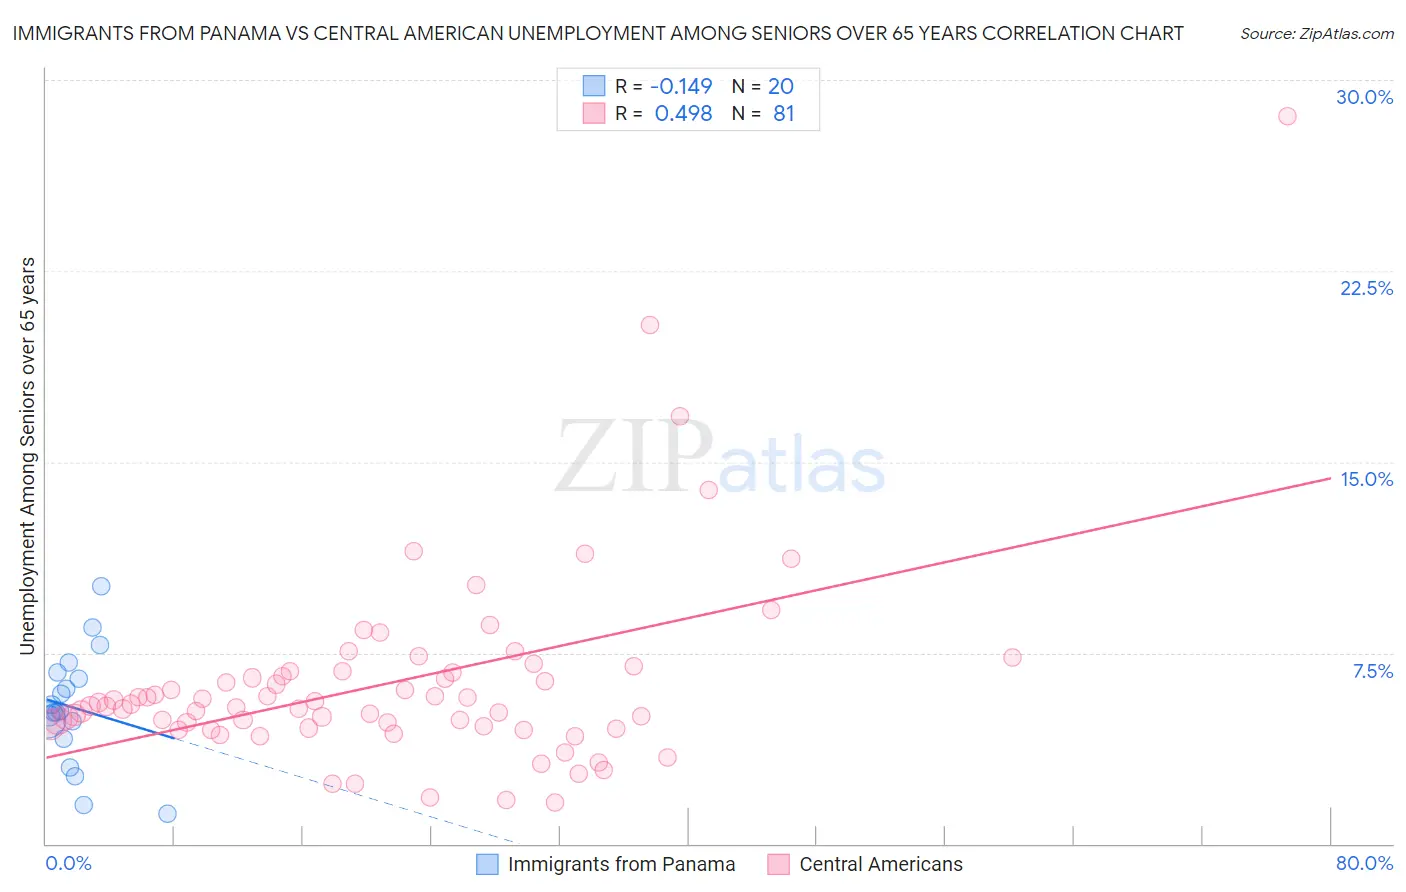
Immigrants from Panama vs Central American Unemployment Among Seniors over 65 years Correlation Chart
The statistical analysis conducted on geographies consisting of 209,001,449 people shows a poor negative correlation between the proportion of Immigrants from Panama and unemployment rate amomg seniors over the age of 65 in the United States with a correlation coefficient (R) of -0.149 and weighted average of 5.1%. Similarly, the statistical analysis conducted on geographies consisting of 433,188,019 people shows a moderate positive correlation between the proportion of Central Americans and unemployment rate amomg seniors over the age of 65 in the United States with a correlation coefficient (R) of 0.498 and weighted average of 5.5%, a difference of 8.2%.
Unemployment Among Seniors over 65 years Correlation Summary
| Measurement | Immigrants from Panama | Central American |
| Minimum | 1.2% | 1.6% |
| Maximum | 10.1% | 28.6% |
| Range | 8.9% | 27.0% |
| Mean | 5.3% | 6.3% |
| Median | 5.2% | 5.4% |
| Interquartile 25% (IQ1) | 4.5% | 4.6% |
| Interquartile 75% (IQ3) | 6.6% | 6.8% |
| Interquartile Range (IQR) | 2.2% | 2.2% |
| Standard Deviation (Sample) | 2.2% | 3.9% |
| Standard Deviation (Population) | 2.2% | 3.9% |
Similar Demographics by Unemployment Among Seniors over 65 years
Demographics Similar to Immigrants from Panama by Unemployment Among Seniors over 65 years
In terms of unemployment among seniors over 65 years, the demographic groups most similar to Immigrants from Panama are Immigrants from Chile (5.1%, a difference of 0.0%), New Zealander (5.1%, a difference of 0.010%), Ukrainian (5.1%, a difference of 0.080%), White/Caucasian (5.1%, a difference of 0.080%), and Arab (5.1%, a difference of 0.080%).
| Demographics | Rating | Rank | Unemployment Among Seniors over 65 years |
| Chileans | 85.6 /100 | #132 | Excellent 5.1% |
| Syrians | 85.3 /100 | #133 | Excellent 5.1% |
| Turks | 84.9 /100 | #134 | Excellent 5.1% |
| Ukrainians | 84.4 /100 | #135 | Excellent 5.1% |
| Whites/Caucasians | 84.4 /100 | #136 | Excellent 5.1% |
| Arabs | 84.3 /100 | #137 | Excellent 5.1% |
| New Zealanders | 83.2 /100 | #138 | Excellent 5.1% |
| Immigrants | Panama | 83.0 /100 | #139 | Excellent 5.1% |
| Immigrants | Chile | 83.0 /100 | #140 | Excellent 5.1% |
| Cherokee | 81.6 /100 | #141 | Excellent 5.1% |
| Immigrants | Indonesia | 81.0 /100 | #142 | Excellent 5.1% |
| Senegalese | 80.4 /100 | #143 | Excellent 5.1% |
| Poles | 80.3 /100 | #144 | Excellent 5.1% |
| Spanish | 78.8 /100 | #145 | Good 5.1% |
| Immigrants | Russia | 78.5 /100 | #146 | Good 5.1% |
Demographics Similar to Central Americans by Unemployment Among Seniors over 65 years
In terms of unemployment among seniors over 65 years, the demographic groups most similar to Central Americans are Immigrants from Barbados (5.5%, a difference of 0.030%), Venezuelan (5.5%, a difference of 0.050%), Immigrants from Liberia (5.5%, a difference of 0.060%), U.S. Virgin Islander (5.5%, a difference of 0.060%), and Immigrants from Cabo Verde (5.5%, a difference of 0.080%).
| Demographics | Rating | Rank | Unemployment Among Seniors over 65 years |
| Colville | 0.1 /100 | #278 | Tragic 5.4% |
| Brazilians | 0.1 /100 | #279 | Tragic 5.5% |
| Immigrants | South America | 0.1 /100 | #280 | Tragic 5.5% |
| Immigrants | Norway | 0.0 /100 | #281 | Tragic 5.5% |
| Immigrants | Belize | 0.0 /100 | #282 | Tragic 5.5% |
| Immigrants | Haiti | 0.0 /100 | #283 | Tragic 5.5% |
| Immigrants | Liberia | 0.0 /100 | #284 | Tragic 5.5% |
| Central Americans | 0.0 /100 | #285 | Tragic 5.5% |
| Immigrants | Barbados | 0.0 /100 | #286 | Tragic 5.5% |
| Venezuelans | 0.0 /100 | #287 | Tragic 5.5% |
| U.S. Virgin Islanders | 0.0 /100 | #288 | Tragic 5.5% |
| Immigrants | Cabo Verde | 0.0 /100 | #289 | Tragic 5.5% |
| Jamaicans | 0.0 /100 | #290 | Tragic 5.5% |
| Blacks/African Americans | 0.0 /100 | #291 | Tragic 5.5% |
| Belizeans | 0.0 /100 | #292 | Tragic 5.5% |