Immigrants from Pakistan vs Ugandan Unemployment
COMPARE
Immigrants from Pakistan
Ugandan
Unemployment
Unemployment Comparison
Immigrants from Pakistan
Ugandans
5.1%
UNEMPLOYMENT
83.2/ 100
METRIC RATING
142nd/ 347
METRIC RANK
5.4%
UNEMPLOYMENT
18.0/ 100
METRIC RATING
212th/ 347
METRIC RANK
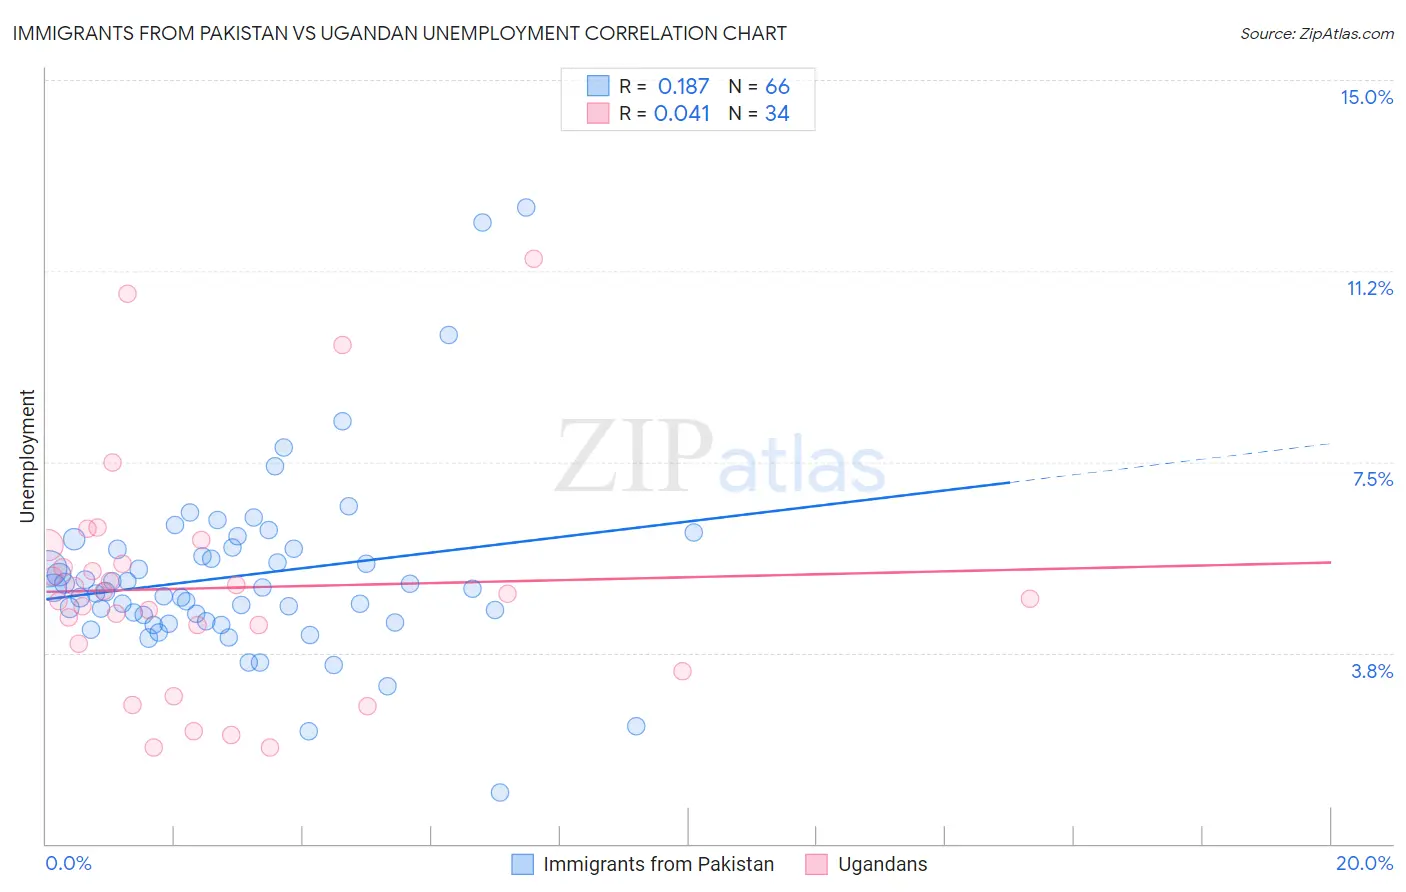
Immigrants from Pakistan vs Ugandan Unemployment Correlation Chart
The statistical analysis conducted on geographies consisting of 283,838,278 people shows a poor positive correlation between the proportion of Immigrants from Pakistan and unemployment in the United States with a correlation coefficient (R) of 0.187 and weighted average of 5.1%. Similarly, the statistical analysis conducted on geographies consisting of 94,004,444 people shows no correlation between the proportion of Ugandans and unemployment in the United States with a correlation coefficient (R) of 0.041 and weighted average of 5.4%, a difference of 4.9%.
Unemployment Correlation Summary
| Measurement | Immigrants from Pakistan | Ugandan |
| Minimum | 1.0% | 1.9% |
| Maximum | 12.5% | 11.5% |
| Range | 11.5% | 9.6% |
| Mean | 5.3% | 5.0% |
| Median | 5.0% | 4.8% |
| Interquartile 25% (IQ1) | 4.4% | 3.9% |
| Interquartile 75% (IQ3) | 5.8% | 5.5% |
| Interquartile Range (IQR) | 1.4% | 1.6% |
| Standard Deviation (Sample) | 1.8% | 2.2% |
| Standard Deviation (Population) | 1.8% | 2.2% |
Similar Demographics by Unemployment
Demographics Similar to Immigrants from Pakistan by Unemployment
In terms of unemployment, the demographic groups most similar to Immigrants from Pakistan are Palestinian (5.1%, a difference of 0.020%), Immigrants from Chile (5.1%, a difference of 0.050%), Indonesian (5.1%, a difference of 0.10%), Immigrants from Denmark (5.1%, a difference of 0.12%), and Immigrants from Norway (5.1%, a difference of 0.15%).
| Demographics | Rating | Rank | Unemployment |
| Immigrants | Burma/Myanmar | 86.2 /100 | #135 | Excellent 5.1% |
| Immigrants | Spain | 86.2 /100 | #136 | Excellent 5.1% |
| Immigrants | Saudi Arabia | 85.6 /100 | #137 | Excellent 5.1% |
| Immigrants | Hungary | 85.6 /100 | #138 | Excellent 5.1% |
| Pakistanis | 85.3 /100 | #139 | Excellent 5.1% |
| Immigrants | Denmark | 84.3 /100 | #140 | Excellent 5.1% |
| Palestinians | 83.4 /100 | #141 | Excellent 5.1% |
| Immigrants | Pakistan | 83.2 /100 | #142 | Excellent 5.1% |
| Immigrants | Chile | 82.8 /100 | #143 | Excellent 5.1% |
| Indonesians | 82.3 /100 | #144 | Excellent 5.1% |
| Immigrants | Norway | 81.8 /100 | #145 | Excellent 5.1% |
| Immigrants | Asia | 81.8 /100 | #146 | Excellent 5.1% |
| Indians (Asian) | 81.6 /100 | #147 | Excellent 5.1% |
| Immigrants | Italy | 79.1 /100 | #148 | Good 5.1% |
| Syrians | 77.7 /100 | #149 | Good 5.2% |
Demographics Similar to Ugandans by Unemployment
In terms of unemployment, the demographic groups most similar to Ugandans are Iraqi (5.4%, a difference of 0.010%), Immigrants from Iraq (5.4%, a difference of 0.060%), Immigrants from Iran (5.4%, a difference of 0.080%), Portuguese (5.4%, a difference of 0.11%), and Creek (5.4%, a difference of 0.14%).
| Demographics | Rating | Rank | Unemployment |
| Native Hawaiians | 24.1 /100 | #205 | Fair 5.3% |
| Immigrants | Peru | 22.7 /100 | #206 | Fair 5.4% |
| Creek | 19.4 /100 | #207 | Poor 5.4% |
| Portuguese | 19.0 /100 | #208 | Poor 5.4% |
| Immigrants | Iran | 18.8 /100 | #209 | Poor 5.4% |
| Immigrants | Iraq | 18.6 /100 | #210 | Poor 5.4% |
| Iraqis | 18.1 /100 | #211 | Poor 5.4% |
| Ugandans | 18.0 /100 | #212 | Poor 5.4% |
| Immigrants | Middle Africa | 15.3 /100 | #213 | Poor 5.4% |
| Immigrants | Costa Rica | 15.2 /100 | #214 | Poor 5.4% |
| Delaware | 14.7 /100 | #215 | Poor 5.4% |
| Immigrants | South America | 13.5 /100 | #216 | Poor 5.4% |
| Immigrants | Albania | 13.5 /100 | #217 | Poor 5.4% |
| Choctaw | 12.7 /100 | #218 | Poor 5.4% |
| Bangladeshis | 11.2 /100 | #219 | Poor 5.4% |