Immigrants from Pakistan vs Tohono O'odham Unemployment Among Seniors over 75 years
COMPARE
Immigrants from Pakistan
Tohono O'odham
Unemployment Among Seniors over 75 years
Unemployment Among Seniors over 75 years Comparison
Immigrants from Pakistan
Tohono O'odham
8.6%
UNEMPLOYMENT AMONG SENIORS OVER 75 YEARS
79.7/ 100
METRIC RATING
154th/ 347
METRIC RANK
10.8%
UNEMPLOYMENT AMONG SENIORS OVER 75 YEARS
0.0/ 100
METRIC RATING
331st/ 347
METRIC RANK
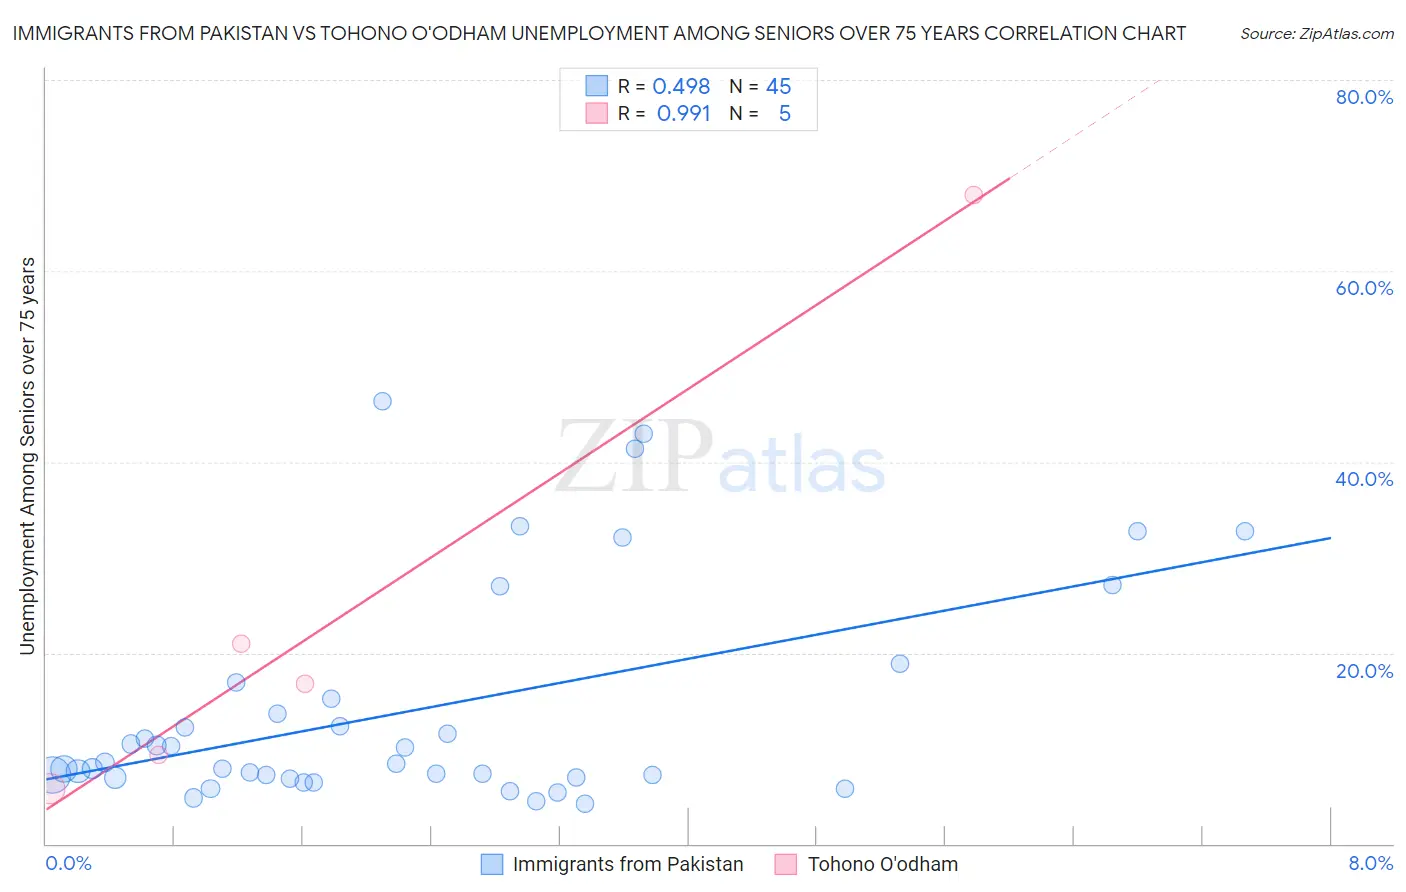
Immigrants from Pakistan vs Tohono O'odham Unemployment Among Seniors over 75 years Correlation Chart
The statistical analysis conducted on geographies consisting of 164,769,281 people shows a moderate positive correlation between the proportion of Immigrants from Pakistan and unemployment rate among seniors over the age of 75 in the United States with a correlation coefficient (R) of 0.498 and weighted average of 8.6%. Similarly, the statistical analysis conducted on geographies consisting of 49,118,042 people shows a perfect positive correlation between the proportion of Tohono O'odham and unemployment rate among seniors over the age of 75 in the United States with a correlation coefficient (R) of 0.991 and weighted average of 10.8%, a difference of 25.9%.
Unemployment Among Seniors over 75 years Correlation Summary
| Measurement | Immigrants from Pakistan | Tohono O'odham |
| Minimum | 4.2% | 5.8% |
| Maximum | 46.3% | 67.9% |
| Range | 42.1% | 62.1% |
| Mean | 14.0% | 24.1% |
| Median | 8.4% | 16.7% |
| Interquartile 25% (IQ1) | 7.0% | 7.6% |
| Interquartile 75% (IQ3) | 16.1% | 44.4% |
| Interquartile Range (IQR) | 9.1% | 36.8% |
| Standard Deviation (Sample) | 11.5% | 25.2% |
| Standard Deviation (Population) | 11.3% | 22.5% |
Similar Demographics by Unemployment Among Seniors over 75 years
Demographics Similar to Immigrants from Pakistan by Unemployment Among Seniors over 75 years
In terms of unemployment among seniors over 75 years, the demographic groups most similar to Immigrants from Pakistan are Mongolian (8.6%, a difference of 0.040%), Latvian (8.6%, a difference of 0.070%), Immigrants from Bosnia and Herzegovina (8.6%, a difference of 0.080%), Ecuadorian (8.6%, a difference of 0.10%), and Paiute (8.6%, a difference of 0.25%).
| Demographics | Rating | Rank | Unemployment Among Seniors over 75 years |
| Immigrants | Sierra Leone | 85.6 /100 | #147 | Excellent 8.5% |
| Immigrants | Colombia | 85.6 /100 | #148 | Excellent 8.5% |
| Immigrants | Ecuador | 84.6 /100 | #149 | Excellent 8.5% |
| Paiute | 82.5 /100 | #150 | Excellent 8.6% |
| Immigrants | Bosnia and Herzegovina | 80.6 /100 | #151 | Excellent 8.6% |
| Latvians | 80.5 /100 | #152 | Excellent 8.6% |
| Mongolians | 80.1 /100 | #153 | Excellent 8.6% |
| Immigrants | Pakistan | 79.7 /100 | #154 | Good 8.6% |
| Ecuadorians | 78.5 /100 | #155 | Good 8.6% |
| Immigrants | Bahamas | 76.5 /100 | #156 | Good 8.6% |
| Turks | 76.4 /100 | #157 | Good 8.6% |
| Ethiopians | 75.3 /100 | #158 | Good 8.6% |
| Shoshone | 74.6 /100 | #159 | Good 8.6% |
| Cree | 72.8 /100 | #160 | Good 8.6% |
| Albanians | 72.8 /100 | #161 | Good 8.6% |
Demographics Similar to Tohono O'odham by Unemployment Among Seniors over 75 years
In terms of unemployment among seniors over 75 years, the demographic groups most similar to Tohono O'odham are Immigrants from Liberia (10.9%, a difference of 0.72%), Immigrants from the Azores (10.7%, a difference of 1.0%), Alaskan Athabascan (11.0%, a difference of 1.9%), Assyrian/Chaldean/Syriac (11.1%, a difference of 2.2%), and Tsimshian (10.5%, a difference of 2.6%).
| Demographics | Rating | Rank | Unemployment Among Seniors over 75 years |
| Americans | 0.0 /100 | #324 | Tragic 10.4% |
| Portuguese | 0.0 /100 | #325 | Tragic 10.4% |
| Slovaks | 0.0 /100 | #326 | Tragic 10.4% |
| Dutch | 0.0 /100 | #327 | Tragic 10.4% |
| Immigrants | Portugal | 0.0 /100 | #328 | Tragic 10.5% |
| Tsimshian | 0.0 /100 | #329 | Tragic 10.5% |
| Immigrants | Azores | 0.0 /100 | #330 | Tragic 10.7% |
| Tohono O'odham | 0.0 /100 | #331 | Tragic 10.8% |
| Immigrants | Liberia | 0.0 /100 | #332 | Tragic 10.9% |
| Alaskan Athabascans | 0.0 /100 | #333 | Tragic 11.0% |
| Assyrians/Chaldeans/Syriacs | 0.0 /100 | #334 | Tragic 11.1% |
| French Canadians | 0.0 /100 | #335 | Tragic 11.2% |
| Immigrants | North Macedonia | 0.0 /100 | #336 | Tragic 11.3% |
| Cape Verdeans | 0.0 /100 | #337 | Tragic 11.4% |
| Immigrants | Cabo Verde | 0.0 /100 | #338 | Tragic 12.3% |