Immigrants from Pakistan vs Czechoslovakian Unemployment Among Ages 45 to 54 years
COMPARE
Immigrants from Pakistan
Czechoslovakian
Unemployment Among Ages 45 to 54 years
Unemployment Among Ages 45 to 54 years Comparison
Immigrants from Pakistan
Czechoslovakians
4.3%
UNEMPLOYMENT AMONG AGES 45 TO 54 YEARS
99.2/ 100
METRIC RATING
61st/ 347
METRIC RANK
4.2%
UNEMPLOYMENT AMONG AGES 45 TO 54 YEARS
99.8/ 100
METRIC RATING
41st/ 347
METRIC RANK
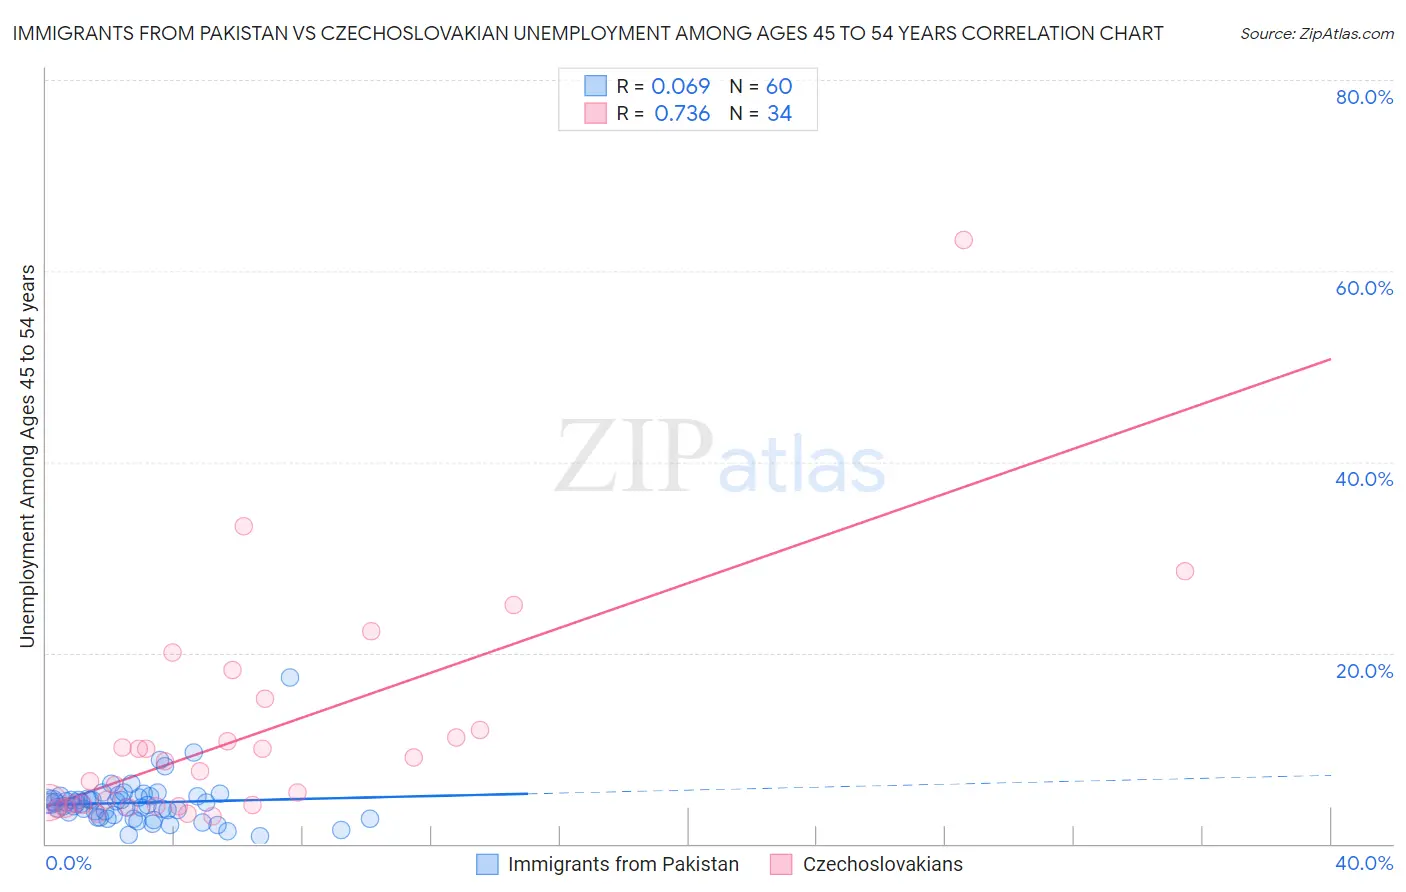
Immigrants from Pakistan vs Czechoslovakian Unemployment Among Ages 45 to 54 years Correlation Chart
The statistical analysis conducted on geographies consisting of 280,232,372 people shows a slight positive correlation between the proportion of Immigrants from Pakistan and unemployment rate among population between the ages 45 and 54 in the United States with a correlation coefficient (R) of 0.069 and weighted average of 4.3%. Similarly, the statistical analysis conducted on geographies consisting of 356,241,688 people shows a strong positive correlation between the proportion of Czechoslovakians and unemployment rate among population between the ages 45 and 54 in the United States with a correlation coefficient (R) of 0.736 and weighted average of 4.2%, a difference of 1.5%.
Unemployment Among Ages 45 to 54 years Correlation Summary
| Measurement | Immigrants from Pakistan | Czechoslovakian |
| Minimum | 0.80% | 2.9% |
| Maximum | 17.4% | 63.2% |
| Range | 16.6% | 60.3% |
| Mean | 4.3% | 11.5% |
| Median | 4.2% | 8.1% |
| Interquartile 25% (IQ1) | 2.9% | 4.0% |
| Interquartile 75% (IQ3) | 4.9% | 11.9% |
| Interquartile Range (IQR) | 2.0% | 7.9% |
| Standard Deviation (Sample) | 2.4% | 12.0% |
| Standard Deviation (Population) | 2.4% | 11.8% |
Demographics Similar to Immigrants from Pakistan and Czechoslovakians by Unemployment Among Ages 45 to 54 years
In terms of unemployment among ages 45 to 54 years, the demographic groups most similar to Immigrants from Pakistan are Immigrants from Korea (4.3%, a difference of 0.0%), Okinawan (4.3%, a difference of 0.040%), Greek (4.3%, a difference of 0.11%), Immigrants from Sri Lanka (4.3%, a difference of 0.16%), and Immigrants from Jordan (4.3%, a difference of 0.22%). Similarly, the demographic groups most similar to Czechoslovakians are Immigrants from Scotland (4.2%, a difference of 0.040%), Zimbabwean (4.2%, a difference of 0.050%), Immigrants from Singapore (4.2%, a difference of 0.31%), Immigrants from Bulgaria (4.2%, a difference of 0.46%), and Luxembourger (4.2%, a difference of 0.56%).
| Demographics | Rating | Rank | Unemployment Among Ages 45 to 54 years |
| Czechoslovakians | 99.8 /100 | #41 | Exceptional 4.2% |
| Immigrants | Scotland | 99.8 /100 | #42 | Exceptional 4.2% |
| Zimbabweans | 99.8 /100 | #43 | Exceptional 4.2% |
| Immigrants | Singapore | 99.7 /100 | #44 | Exceptional 4.2% |
| Immigrants | Bulgaria | 99.7 /100 | #45 | Exceptional 4.2% |
| Luxembourgers | 99.6 /100 | #46 | Exceptional 4.2% |
| Filipinos | 99.6 /100 | #47 | Exceptional 4.2% |
| Finns | 99.6 /100 | #48 | Exceptional 4.2% |
| Immigrants | Zimbabwe | 99.6 /100 | #49 | Exceptional 4.2% |
| Basques | 99.6 /100 | #50 | Exceptional 4.2% |
| Burmese | 99.6 /100 | #51 | Exceptional 4.2% |
| Poles | 99.5 /100 | #52 | Exceptional 4.2% |
| Irish | 99.5 /100 | #53 | Exceptional 4.2% |
| Chickasaw | 99.5 /100 | #54 | Exceptional 4.2% |
| Latvians | 99.4 /100 | #55 | Exceptional 4.2% |
| Immigrants | Jordan | 99.3 /100 | #56 | Exceptional 4.3% |
| Immigrants | Sri Lanka | 99.3 /100 | #57 | Exceptional 4.3% |
| Greeks | 99.3 /100 | #58 | Exceptional 4.3% |
| Okinawans | 99.2 /100 | #59 | Exceptional 4.3% |
| Immigrants | Korea | 99.2 /100 | #60 | Exceptional 4.3% |
| Immigrants | Pakistan | 99.2 /100 | #61 | Exceptional 4.3% |