Immigrants from Oceania vs New Zealander Unemployment Among Youth under 25 years

COMPARE

Immigrants from Oceania
Race
Ancestry
AfghanAfricanAlaska NativeAlaskan AthabascanAlbanianAleutAlsatianAmericanApacheArabArapahoArgentineanArmenianAssyrian/Chaldean/SyriacAustralianAustrianBahamianBangladeshiBarbadianBasqueBelgianBelizeanBermudanBhutaneseBlackfeetBolivianBrazilianBritishBritish West IndianBulgarianBurmeseCajunCambodianCanadianCape VerdeanCarpatho RusynCelticCentral AmericanCentral American IndianCherokeeCheyenneChickasawChileanChineseChippewaChoctawColombianColvilleComancheCosta RicanCreeCreekCroatianCrowCubanCypriotCzechCzechoslovakianDanishDelawareDominicanDutchDutch West IndianEastern EuropeanEcuadorianEgyptianEnglishEstonianEthiopianEuropeanFijianFilipinoFinnishFrenchFrench American IndianFrench CanadianGermanGerman RussianGhanaianGreekGuamanian/ChamorroGuatemalanGuyaneseHaitianHmongHonduranHopiHoumaHungarianIcelanderIndian (Asian)IndonesianInupiatIranianIraqiIrishIroquoisIsraeliItalianJamaicanJapaneseJordanianKenyanKiowaKoreanLaotianLatvianLebaneseLiberianLithuanianLumbeeLuxembourgerMacedonianMalaysianMalteseMarshalleseMenomineeMexicanMexican American IndianMongolianMoroccanNative HawaiianNavajoNepaleseNicaraguanNigerianNorthern EuropeanNorwegianOkinawanOsageOttawaPaiutePakistaniPalestinianPanamanianParaguayanPennsylvania GermanPeruvianPimaPolishPortuguesePotawatomiPuebloPuerto RicanPuget Sound SalishRomanianRussianSalvadoranSamoanScandinavianScotch-IrishScottishSeminoleSenegaleseSerbianShoshoneSierra LeoneanSiouxSlavicSlovakSloveneSomaliSouth AfricanSouth AmericanSouth American IndianSoviet UnionSpaniardSpanishSpanish AmericanSpanish American IndianSri LankanSubsaharan AfricanSudaneseSwedishSwissSyrianTaiwaneseThaiTlingit-HaidaTohono O'OdhamTonganTrinidadian and TobagonianTsimshianTurkishU.S. Virgin IslanderUgandanUkrainianUruguayanUteVenezuelanVietnameseWelshWest IndianYakamaYaquiYugoslavianYumanYup'ikZimbabwean
Immigration
NonimmigrantsImmigrantsAfghanistanAfricaAlbaniaArgentinaArmeniaAsiaAustraliaAustriaBahamasBangladeshBarbadosBelarusBelgiumBelizeBoliviaBosnia and HerzegovinaBrazilBulgariaBurma/MyanmarCabo VerdeCambodiaCameroonCanadaCaribbeanCentral AmericaChileChinaColombiaCongoCosta RicaCroatiaCubaCzechoslovakiaDenmarkDominicaDominican RepublicEastern AfricaEastern AsiaEastern EuropeEcuadorEgyptEl SalvadorEnglandEritreaEthiopiaEuropeFijiFranceGermanyGhanaGreeceGrenadaGuatemalaGuyanaHaitiHondurasHong KongHungaryIndiaIndonesiaIranIraqIrelandIsraelItalyJamaicaJapanJordanKazakhstanKenyaKoreaKuwaitLaosLatin AmericaLatviaLebanonLiberiaLithuaniaMalaysiaMexicoMicronesiaMiddle AfricaMoldovaMoroccoNepalNetherlandsNicaraguaNigeriaNorth AmericaNorth MacedoniaNorthern AfricaNorthern EuropeNorwayOceaniaPakistanPanamaPeruPhilippinesPolandPortugalRomaniaRussiaSaudi ArabiaScotlandSenegalSerbiaSierra LeoneSingaporeSomaliaSouth AfricaSouth AmericaSouth Central AsiaSouth Eastern AsiaSouthern EuropeSpainSri LankaSt. Vincent and the GrenadinesSudanSwedenSwitzerlandSyriaTaiwanThailandTrinidad and TobagoTurkeyUgandaUkraineUruguayUzbekistanVenezuelaVietnamWest IndiesWestern AfricaWestern AsiaWestern EuropeYemenZaireZimbabweAzores
New Zealander
Race
Ancestry
AfghanAfricanAlaska NativeAlaskan AthabascanAlbanianAleutAlsatianAmericanApacheArabArapahoArgentineanArmenianAssyrian/Chaldean/SyriacAustralianAustrianBahamianBangladeshiBarbadianBasqueBelgianBelizeanBermudanBhutaneseBlackfeetBolivianBrazilianBritishBritish West IndianBulgarianBurmeseCajunCambodianCanadianCape VerdeanCarpatho RusynCelticCentral AmericanCentral American IndianCherokeeCheyenneChickasawChileanChineseChippewaChoctawColombianColvilleComancheCosta RicanCreeCreekCroatianCrowCubanCypriotCzechCzechoslovakianDanishDelawareDominicanDutchDutch West IndianEastern EuropeanEcuadorianEgyptianEnglishEstonianEthiopianEuropeanFijianFilipinoFinnishFrenchFrench American IndianFrench CanadianGermanGerman RussianGhanaianGreekGuamanian/ChamorroGuatemalanGuyaneseHaitianHmongHonduranHopiHoumaHungarianIcelanderIndian (Asian)IndonesianInupiatIranianIraqiIrishIroquoisIsraeliItalianJamaicanJapaneseJordanianKenyanKiowaKoreanLaotianLatvianLebaneseLiberianLithuanianLumbeeLuxembourgerMacedonianMalaysianMalteseMarshalleseMenomineeMexicanMexican American IndianMongolianMoroccanNative HawaiianNavajoNepaleseNew ZealanderNicaraguanNigerianNorthern EuropeanNorwegianOkinawanOsageOttawaPaiutePakistaniPalestinianPanamanianParaguayanPennsylvania GermanPeruvianPimaPolishPortuguesePotawatomiPuebloPuerto RicanPuget Sound SalishRomanianRussianSalvadoranSamoanScandinavianScotch-IrishScottishSeminoleSenegaleseSerbianShoshoneSierra LeoneanSiouxSlavicSlovakSloveneSomaliSouth AfricanSouth AmericanSouth American IndianSoviet UnionSpaniardSpanishSpanish AmericanSpanish American IndianSri LankanSubsaharan AfricanSudaneseSwedishSwissSyrianTaiwaneseThaiTlingit-HaidaTohono O'OdhamTonganTrinidadian and TobagonianTsimshianTurkishU.S. Virgin IslanderUgandanUkrainianUruguayanUteVenezuelanVietnameseWelshWest IndianYakamaYaquiYugoslavianYumanYup'ikZimbabwean
Immigration
NonimmigrantsImmigrantsAfghanistanAfricaAlbaniaArgentinaArmeniaAsiaAustraliaAustriaBahamasBangladeshBarbadosBelarusBelgiumBelizeBoliviaBosnia and HerzegovinaBrazilBulgariaBurma/MyanmarCabo VerdeCambodiaCameroonCanadaCaribbeanCentral AmericaChileChinaColombiaCongoCosta RicaCroatiaCubaCzechoslovakiaDenmarkDominicaDominican RepublicEastern AfricaEastern AsiaEastern EuropeEcuadorEgyptEl SalvadorEnglandEritreaEthiopiaEuropeFijiFranceGermanyGhanaGreeceGrenadaGuatemalaGuyanaHaitiHondurasHong KongHungaryIndiaIndonesiaIranIraqIrelandIsraelItalyJamaicaJapanJordanKazakhstanKenyaKoreaKuwaitLaosLatin AmericaLatviaLebanonLiberiaLithuaniaMalaysiaMexicoMicronesiaMiddle AfricaMoldovaMoroccoNepalNetherlandsNicaraguaNigeriaNorth AmericaNorth MacedoniaNorthern AfricaNorthern EuropeNorwayPakistanPanamaPeruPhilippinesPolandPortugalRomaniaRussiaSaudi ArabiaScotlandSenegalSerbiaSierra LeoneSingaporeSomaliaSouth AfricaSouth AmericaSouth Central AsiaSouth Eastern AsiaSouthern EuropeSpainSri LankaSt. Vincent and the GrenadinesSudanSwedenSwitzerlandSyriaTaiwanThailandTrinidad and TobagoTurkeyUgandaUkraineUruguayUzbekistanVenezuelaVietnamWest IndiesWestern AfricaWestern AsiaWestern EuropeYemenZaireZimbabweAzores
Unemployment Among Youth under 25 years
Income
Poverty
Unemployment
Labor Participation
Family Structure
Vehicle Availability
Education Level
Disability

Unemployment Among Youth under 25 years Comparison

Immigrants from Oceania

New Zealanders

Excellent
Exceptional
11.4%
UNEMPLOYMENT AMONG YOUTH UNDER 25 YEARS
80.2/ 100
METRIC RATING
135th/ 347
METRIC RANK
11.2%
UNEMPLOYMENT AMONG YOUTH UNDER 25 YEARS
97.2/ 100
METRIC RATING
74th/ 347
METRIC RANK

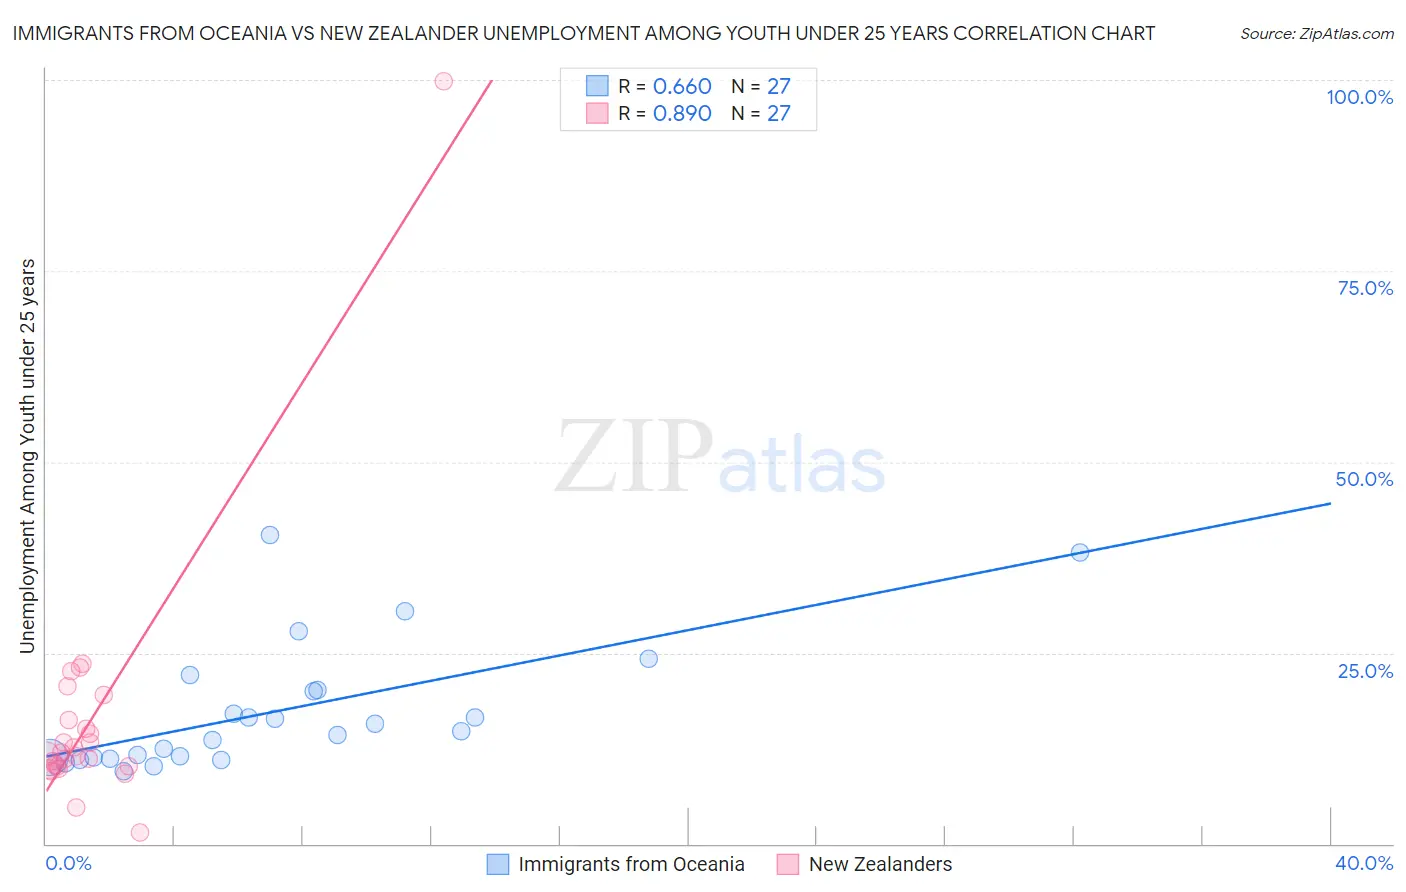
Immigrants from Oceania vs New Zealander Unemployment Among Youth under 25 years Correlation Chart

The statistical analysis conducted on geographies consisting of 302,499,888 people shows a significant positive correlation between the proportion of Immigrants from Oceania and unemployment rate among youth under the age of 25 in the United States with a correlation coefficient (R) of 0.660 and weighted average of 11.4%. Similarly, the statistical analysis conducted on geographies consisting of 106,451,215 people shows a very strong positive correlation between the proportion of New Zealanders and unemployment rate among youth under the age of 25 in the United States with a correlation coefficient (R) of 0.890 and weighted average of 11.2%, a difference of 2.3%.
Immigrants from Oceania vs New Zealander Unemployment Among Youth under 25 years

Unemployment Among Youth under 25 years Correlation Summary

MeasurementImmigrants from OceaniaNew Zealander
Minimum9.4%1.4%
Maximum40.5%99.9%
Range31.1%98.5%
Mean17.4%16.2%
Median14.8%11.8%
Interquartile 25% (IQ1)11.3%10.1%
Interquartile 75% (IQ3)20.2%16.3%
Interquartile Range (IQR)8.9%6.2%
Standard Deviation (Sample)8.3%17.5%
Standard Deviation (Population)8.2%17.2%

Similar Demographics by Unemployment Among Youth under 25 years

Demographics Similar to Immigrants from Oceania by Unemployment Among Youth under 25 years

In terms of unemployment among youth under 25 years, the demographic groups most similar to Immigrants from Oceania are Immigrants from Chile (11.4%, a difference of 0.010%), Romanian (11.4%, a difference of 0.010%), Asian (11.4%, a difference of 0.040%), Immigrants from England (11.5%, a difference of 0.14%), and Immigrants from Indonesia (11.5%, a difference of 0.16%).
DemographicsRating | RankUnemployment Among Youth under 25 years
Immigrants | Hungary
86.0
/100
|
#128
Excellent
11.4%
Turks
85.8
/100
|
#129
Excellent
11.4%
Hungarians
85.7
/100
|
#130
Excellent
11.4%
Immigrants | Spain
84.6
/100
|
#131
Excellent
11.4%
Ethiopians
83.2
/100
|
#132
Excellent
11.4%
Lebanese
83.1
/100
|
#133
Excellent
11.4%
Immigrants | Chile
80.4
/100
|
#134
Excellent
11.4%
Immigrants | Oceania
80.2
/100
|
#135
Excellent
11.4%
Romanians
80.1
/100
|
#136
Excellent
11.4%
Asians
79.7
/100
|
#137
Good
11.4%
Immigrants | England
78.1
/100
|
#138
Good
11.5%
Immigrants | Indonesia
77.6
/100
|
#139
Good
11.5%
Immigrants | Belgium
77.5
/100
|
#140
Good
11.5%
Immigrants | Uruguay
76.1
/100
|
#141
Good
11.5%
Immigrants | Korea
75.1
/100
|
#142
Good
11.5%

Demographics Similar to New Zealanders by Unemployment Among Youth under 25 years

In terms of unemployment among youth under 25 years, the demographic groups most similar to New Zealanders are Creek (11.2%, a difference of 0.010%), French (11.2%, a difference of 0.030%), German Russian (11.2%, a difference of 0.050%), Immigrants from Australia (11.2%, a difference of 0.060%), and Bhutanese (11.2%, a difference of 0.10%).
DemographicsRating | RankUnemployment Among Youth under 25 years
Chickasaw
97.7
/100
|
#67
Exceptional
11.2%
Immigrants | Kenya
97.6
/100
|
#68
Exceptional
11.2%
Immigrants | Moldova
97.5
/100
|
#69
Exceptional
11.2%
Slavs
97.5
/100
|
#70
Exceptional
11.2%
Bhutanese
97.4
/100
|
#71
Exceptional
11.2%
Immigrants | Australia
97.3
/100
|
#72
Exceptional
11.2%
Creek
97.2
/100
|
#73
Exceptional
11.2%
New Zealanders
97.2
/100
|
#74
Exceptional
11.2%
French
97.1
/100
|
#75
Exceptional
11.2%
German Russians
97.0
/100
|
#76
Exceptional
11.2%
Whites/Caucasians
96.9
/100
|
#77
Exceptional
11.2%
Immigrants | Nicaragua
96.7
/100
|
#78
Exceptional
11.2%
Immigrants | Canada
96.7
/100
|
#79
Exceptional
11.2%
Immigrants | Bulgaria
96.4
/100
|
#80
Exceptional
11.2%
Icelanders
96.3
/100
|
#81
Exceptional
11.2%