Immigrants from Norway vs Scottish Unemployment Among Ages 30 to 34 years
COMPARE
Immigrants from Norway
Scottish
Unemployment Among Ages 30 to 34 years
Unemployment Among Ages 30 to 34 years Comparison
Immigrants from Norway
Scottish
5.5%
UNEMPLOYMENT AMONG AGES 30 TO 34 YEARS
36.1/ 100
METRIC RATING
188th/ 347
METRIC RANK
5.5%
UNEMPLOYMENT AMONG AGES 30 TO 34 YEARS
51.8/ 100
METRIC RATING
171st/ 347
METRIC RANK
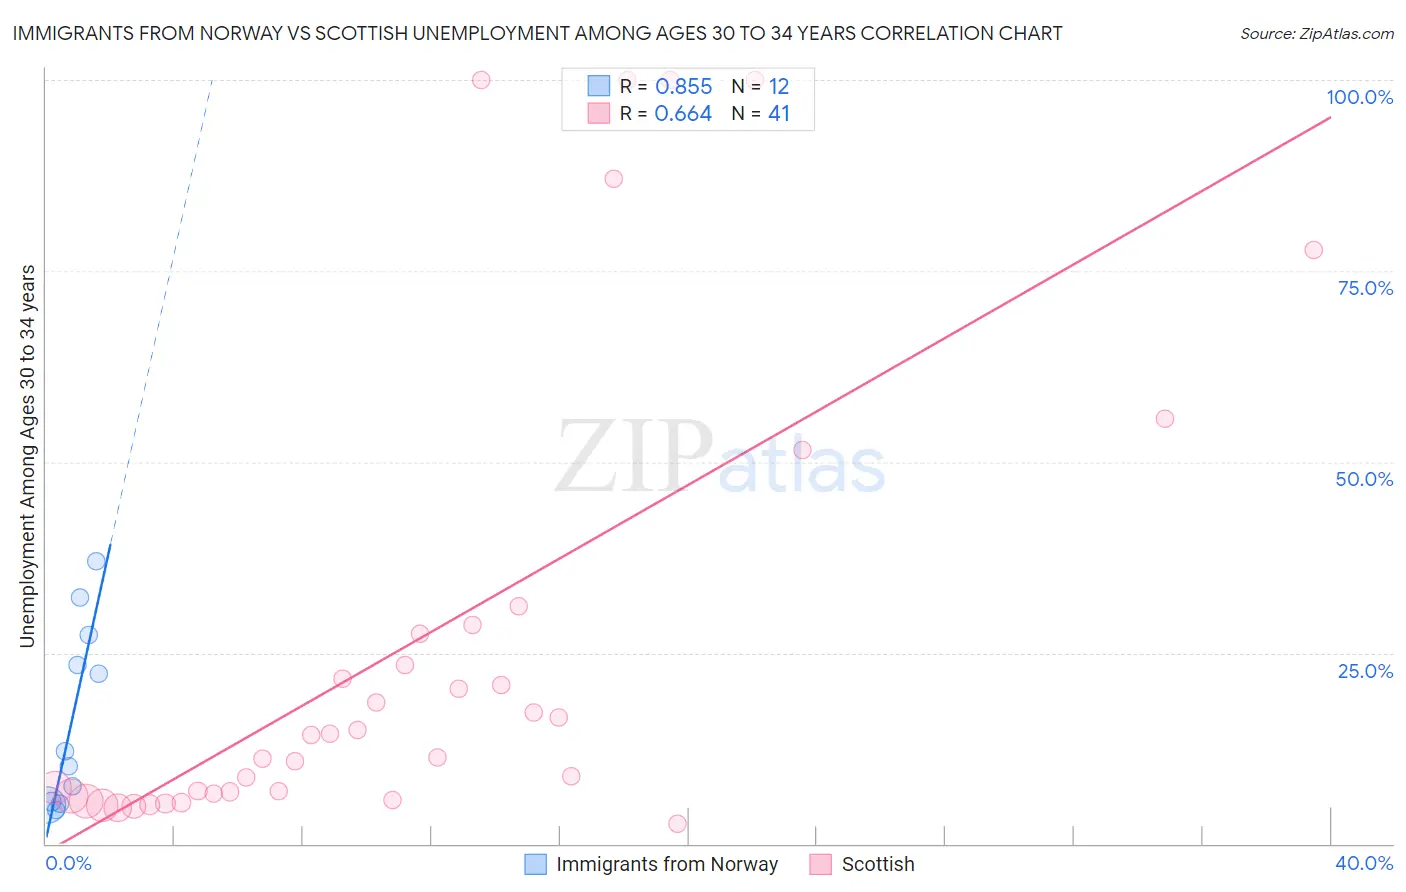
Immigrants from Norway vs Scottish Unemployment Among Ages 30 to 34 years Correlation Chart
The statistical analysis conducted on geographies consisting of 113,369,472 people shows a very strong positive correlation between the proportion of Immigrants from Norway and unemployment rate among population between the ages 30 and 34 in the United States with a correlation coefficient (R) of 0.855 and weighted average of 5.5%. Similarly, the statistical analysis conducted on geographies consisting of 494,408,202 people shows a significant positive correlation between the proportion of Scottish and unemployment rate among population between the ages 30 and 34 in the United States with a correlation coefficient (R) of 0.664 and weighted average of 5.5%, a difference of 1.1%.
Unemployment Among Ages 30 to 34 years Correlation Summary
| Measurement | Immigrants from Norway | Scottish |
| Minimum | 4.5% | 2.7% |
| Maximum | 37.0% | 100.0% |
| Range | 32.5% | 97.3% |
| Mean | 16.0% | 26.3% |
| Median | 11.1% | 14.3% |
| Interquartile 25% (IQ1) | 5.4% | 6.4% |
| Interquartile 75% (IQ3) | 25.3% | 28.0% |
| Interquartile Range (IQR) | 19.9% | 21.6% |
| Standard Deviation (Sample) | 11.8% | 30.8% |
| Standard Deviation (Population) | 11.3% | 30.5% |
Demographics Similar to Immigrants from Norway and Scottish by Unemployment Among Ages 30 to 34 years
In terms of unemployment among ages 30 to 34 years, the demographic groups most similar to Immigrants from Norway are Immigrants from England (5.5%, a difference of 0.030%), Canadian (5.5%, a difference of 0.16%), Immigrants from Western Asia (5.5%, a difference of 0.16%), Immigrants from Western Europe (5.5%, a difference of 0.23%), and Malaysian (5.5%, a difference of 0.41%). Similarly, the demographic groups most similar to Scottish are Immigrants from Austria (5.5%, a difference of 0.030%), Dutch (5.5%, a difference of 0.060%), Immigrants from Israel (5.4%, a difference of 0.070%), Peruvian (5.5%, a difference of 0.11%), and Immigrants from Laos (5.5%, a difference of 0.12%).
| Demographics | Rating | Rank | Unemployment Among Ages 30 to 34 years |
| Immigrants | Israel | 52.9 /100 | #169 | Average 5.4% |
| Dutch | 52.6 /100 | #170 | Average 5.5% |
| Scottish | 51.8 /100 | #171 | Average 5.5% |
| Immigrants | Austria | 51.3 /100 | #172 | Average 5.5% |
| Peruvians | 50.2 /100 | #173 | Average 5.5% |
| Immigrants | Laos | 50.0 /100 | #174 | Average 5.5% |
| Afghans | 49.6 /100 | #175 | Average 5.5% |
| Immigrants | Peru | 48.0 /100 | #176 | Average 5.5% |
| Immigrants | Ukraine | 47.7 /100 | #177 | Average 5.5% |
| Macedonians | 47.1 /100 | #178 | Average 5.5% |
| Costa Ricans | 46.7 /100 | #179 | Average 5.5% |
| Italians | 45.5 /100 | #180 | Average 5.5% |
| Immigrants | Lebanon | 43.5 /100 | #181 | Average 5.5% |
| Immigrants | Denmark | 43.4 /100 | #182 | Average 5.5% |
| Hungarians | 43.1 /100 | #183 | Average 5.5% |
| Malaysians | 41.8 /100 | #184 | Average 5.5% |
| Immigrants | Western Europe | 39.1 /100 | #185 | Fair 5.5% |
| Canadians | 38.2 /100 | #186 | Fair 5.5% |
| Immigrants | Western Asia | 38.2 /100 | #187 | Fair 5.5% |
| Immigrants | Norway | 36.1 /100 | #188 | Fair 5.5% |
| Immigrants | England | 35.7 /100 | #189 | Fair 5.5% |