Immigrants from Norway vs Central American Male Unemployment
COMPARE
Immigrants from Norway
Central American
Male Unemployment
Male Unemployment Comparison
Immigrants from Norway
Central Americans
5.2%
MALE UNEMPLOYMENT
71.0/ 100
METRIC RATING
160th/ 347
METRIC RANK
5.6%
MALE UNEMPLOYMENT
1.8/ 100
METRIC RATING
229th/ 347
METRIC RANK
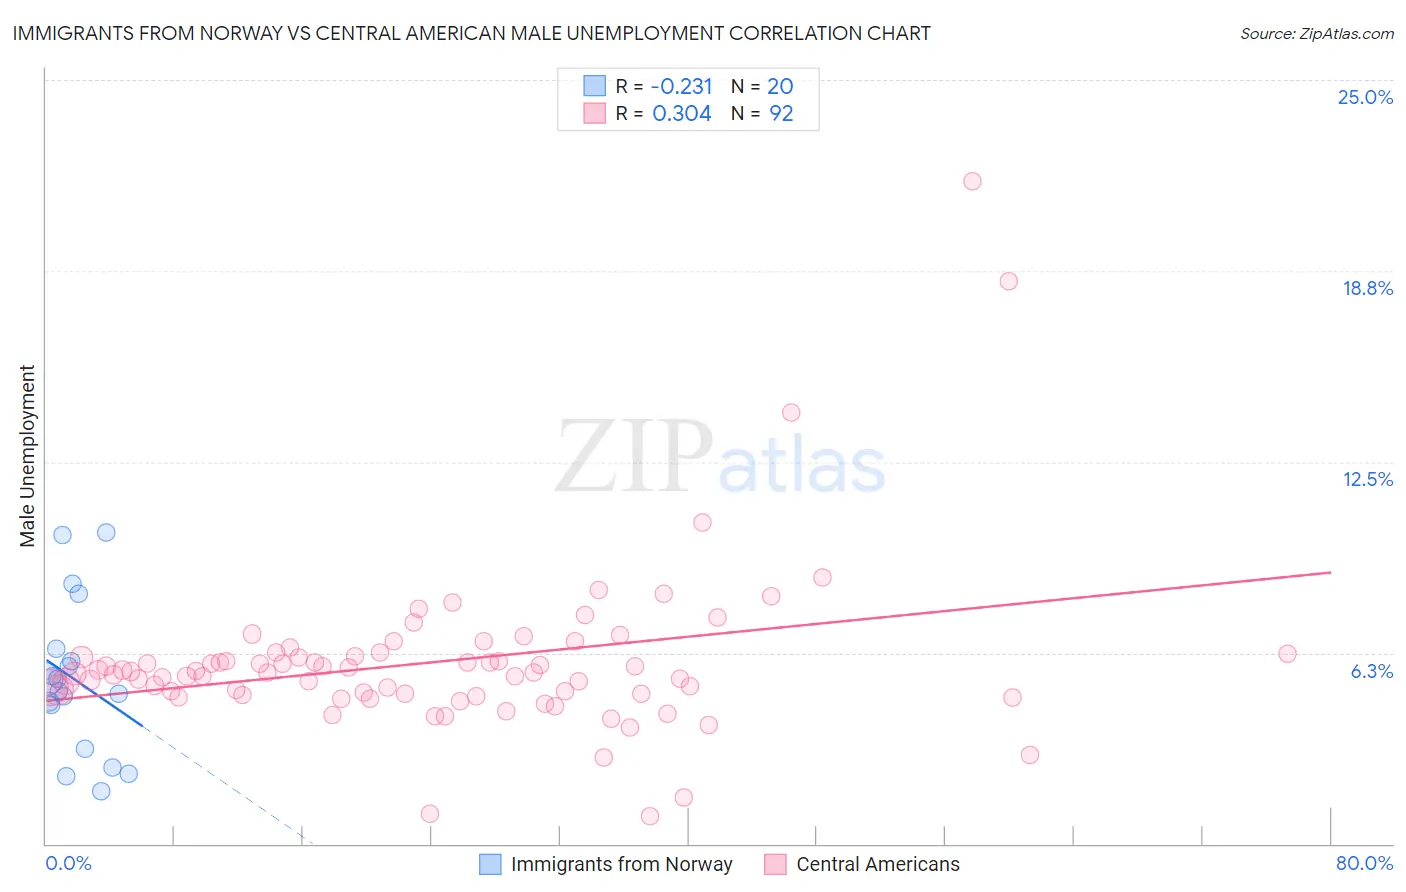
Immigrants from Norway vs Central American Male Unemployment Correlation Chart
The statistical analysis conducted on geographies consisting of 116,545,854 people shows a weak negative correlation between the proportion of Immigrants from Norway and unemployment rate among males in the United States with a correlation coefficient (R) of -0.231 and weighted average of 5.2%. Similarly, the statistical analysis conducted on geographies consisting of 500,623,781 people shows a mild positive correlation between the proportion of Central Americans and unemployment rate among males in the United States with a correlation coefficient (R) of 0.304 and weighted average of 5.6%, a difference of 7.3%.
Male Unemployment Correlation Summary
| Measurement | Immigrants from Norway | Central American |
| Minimum | 1.7% | 0.90% |
| Maximum | 10.2% | 21.7% |
| Range | 8.5% | 20.8% |
| Mean | 5.4% | 5.9% |
| Median | 5.2% | 5.6% |
| Interquartile 25% (IQ1) | 3.8% | 4.9% |
| Interquartile 75% (IQ3) | 6.2% | 6.2% |
| Interquartile Range (IQR) | 2.4% | 1.3% |
| Standard Deviation (Sample) | 2.4% | 2.7% |
| Standard Deviation (Population) | 2.4% | 2.7% |
Similar Demographics by Male Unemployment
Demographics Similar to Immigrants from Norway by Male Unemployment
In terms of male unemployment, the demographic groups most similar to Immigrants from Norway are Indonesian (5.2%, a difference of 0.010%), Immigrants from China (5.2%, a difference of 0.030%), Immigrants from Indonesia (5.2%, a difference of 0.040%), Immigrants from Northern Africa (5.2%, a difference of 0.090%), and American (5.2%, a difference of 0.12%).
| Demographics | Rating | Rank | Male Unemployment |
| Immigrants | Uruguay | 73.9 /100 | #153 | Good 5.2% |
| Laotians | 73.8 /100 | #154 | Good 5.2% |
| Immigrants | Hungary | 73.4 /100 | #155 | Good 5.2% |
| Americans | 72.7 /100 | #156 | Good 5.2% |
| Immigrants | Northern Africa | 72.3 /100 | #157 | Good 5.2% |
| Immigrants | Indonesia | 71.5 /100 | #158 | Good 5.2% |
| Indonesians | 71.2 /100 | #159 | Good 5.2% |
| Immigrants | Norway | 71.0 /100 | #160 | Good 5.2% |
| Immigrants | China | 70.6 /100 | #161 | Good 5.2% |
| Immigrants | Egypt | 65.9 /100 | #162 | Good 5.2% |
| Immigrants | Hong Kong | 65.7 /100 | #163 | Good 5.2% |
| Afghans | 62.0 /100 | #164 | Good 5.3% |
| South Americans | 60.6 /100 | #165 | Good 5.3% |
| Immigrants | Morocco | 60.2 /100 | #166 | Good 5.3% |
| Immigrants | Vietnam | 58.1 /100 | #167 | Average 5.3% |
Demographics Similar to Central Americans by Male Unemployment
In terms of male unemployment, the demographic groups most similar to Central Americans are Seminole (5.6%, a difference of 0.0%), Immigrants from Panama (5.6%, a difference of 0.020%), Immigrants from Cambodia (5.6%, a difference of 0.030%), Immigrants from Africa (5.6%, a difference of 0.040%), and Choctaw (5.6%, a difference of 0.090%).
| Demographics | Rating | Rank | Male Unemployment |
| Immigrants | Micronesia | 2.9 /100 | #222 | Tragic 5.6% |
| Creek | 2.6 /100 | #223 | Tragic 5.6% |
| Cherokee | 2.4 /100 | #224 | Tragic 5.6% |
| Panamanians | 1.9 /100 | #225 | Tragic 5.6% |
| Immigrants | Cambodia | 1.8 /100 | #226 | Tragic 5.6% |
| Immigrants | Panama | 1.8 /100 | #227 | Tragic 5.6% |
| Seminole | 1.8 /100 | #228 | Tragic 5.6% |
| Central Americans | 1.8 /100 | #229 | Tragic 5.6% |
| Immigrants | Africa | 1.7 /100 | #230 | Tragic 5.6% |
| Choctaw | 1.6 /100 | #231 | Tragic 5.6% |
| Moroccans | 1.6 /100 | #232 | Tragic 5.6% |
| Somalis | 1.5 /100 | #233 | Tragic 5.6% |
| Immigrants | Somalia | 1.5 /100 | #234 | Tragic 5.6% |
| Immigrants | Honduras | 1.5 /100 | #235 | Tragic 5.6% |
| Guatemalans | 1.2 /100 | #236 | Tragic 5.6% |