Immigrants from Northern Europe vs Indian (Asian) Unemployment Among Ages 20 to 24 years
COMPARE
Immigrants from Northern Europe
Indian (Asian)
Unemployment Among Ages 20 to 24 years
Unemployment Among Ages 20 to 24 years Comparison
Immigrants from Northern Europe
Indians (Asian)
10.4%
UNEMPLOYMENT AMONG AGES 20 TO 24 YEARS
19.5/ 100
METRIC RATING
204th/ 347
METRIC RANK
10.3%
UNEMPLOYMENT AMONG AGES 20 TO 24 YEARS
62.6/ 100
METRIC RATING
161st/ 347
METRIC RANK
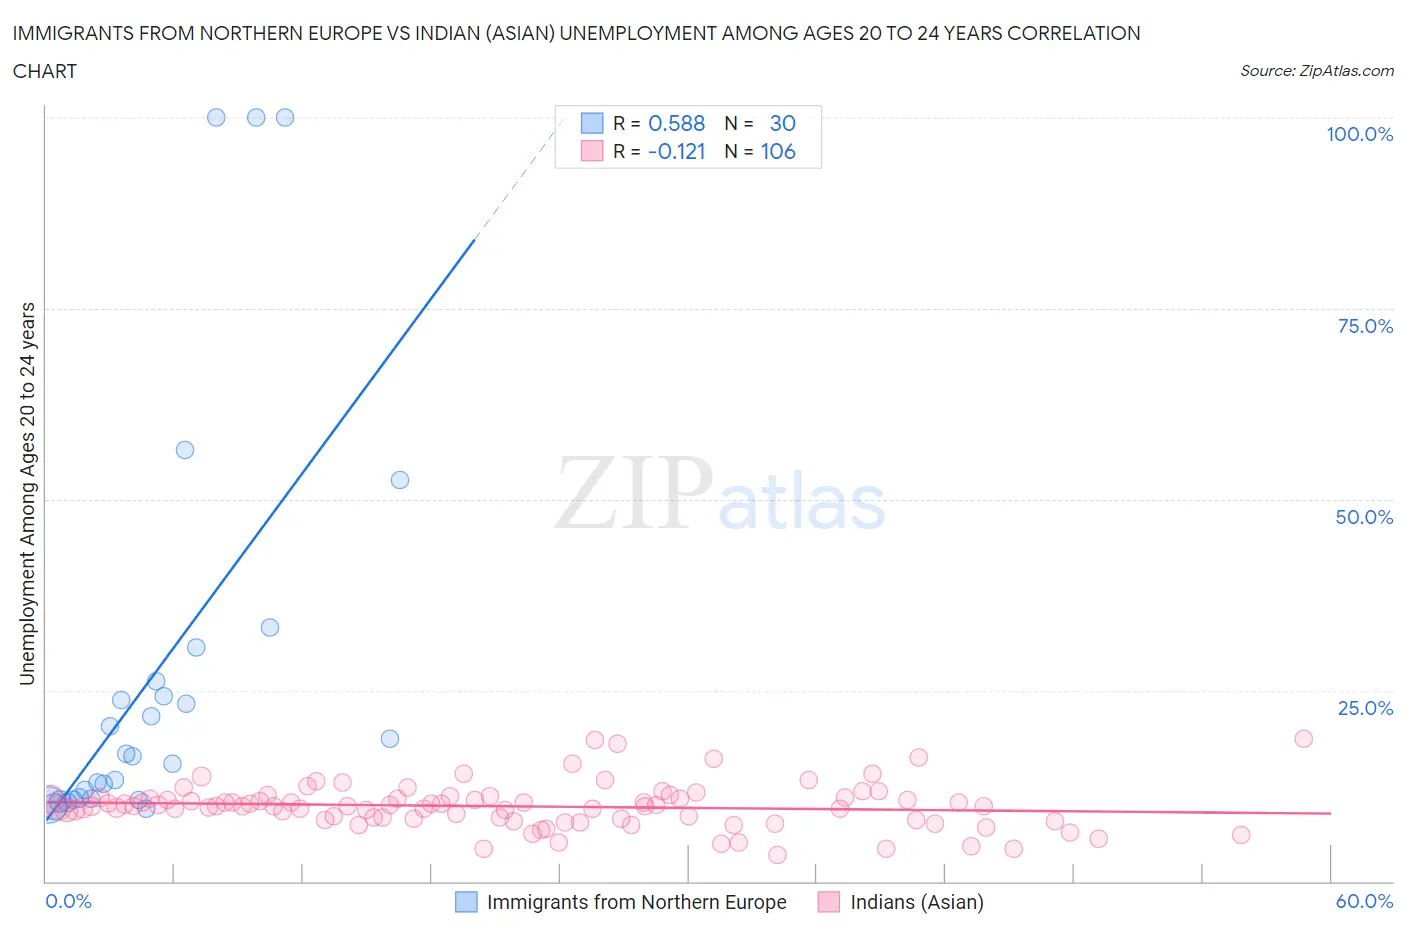
Immigrants from Northern Europe vs Indian (Asian) Unemployment Among Ages 20 to 24 years Correlation Chart
The statistical analysis conducted on geographies consisting of 454,616,054 people shows a substantial positive correlation between the proportion of Immigrants from Northern Europe and unemployment rate among population between the ages 20 and 24 in the United States with a correlation coefficient (R) of 0.588 and weighted average of 10.4%. Similarly, the statistical analysis conducted on geographies consisting of 472,579,242 people shows a poor negative correlation between the proportion of Indians (Asian) and unemployment rate among population between the ages 20 and 24 in the United States with a correlation coefficient (R) of -0.121 and weighted average of 10.3%, a difference of 1.8%.
Unemployment Among Ages 20 to 24 years Correlation Summary
| Measurement | Immigrants from Northern Europe | Indian (Asian) |
| Minimum | 9.4% | 3.5% |
| Maximum | 100.0% | 18.7% |
| Range | 90.6% | 15.2% |
| Mean | 27.4% | 9.8% |
| Median | 16.5% | 9.8% |
| Interquartile 25% (IQ1) | 10.9% | 8.2% |
| Interquartile 75% (IQ3) | 26.2% | 10.9% |
| Interquartile Range (IQR) | 15.3% | 2.7% |
| Standard Deviation (Sample) | 27.2% | 2.9% |
| Standard Deviation (Population) | 26.7% | 2.9% |
Similar Demographics by Unemployment Among Ages 20 to 24 years
Demographics Similar to Immigrants from Northern Europe by Unemployment Among Ages 20 to 24 years
In terms of unemployment among ages 20 to 24 years, the demographic groups most similar to Immigrants from Northern Europe are Cypriot (10.4%, a difference of 0.040%), South American (10.4%, a difference of 0.060%), Immigrants from Europe (10.4%, a difference of 0.060%), Immigrants from Middle Africa (10.4%, a difference of 0.080%), and Russian (10.4%, a difference of 0.090%).
| Demographics | Rating | Rank | Unemployment Among Ages 20 to 24 years |
| Immigrants | Denmark | 22.8 /100 | #197 | Fair 10.4% |
| Colombians | 22.3 /100 | #198 | Fair 10.4% |
| Portuguese | 21.8 /100 | #199 | Fair 10.4% |
| Russians | 21.2 /100 | #200 | Fair 10.4% |
| Immigrants | Peru | 21.2 /100 | #201 | Fair 10.4% |
| Immigrants | Middle Africa | 20.9 /100 | #202 | Fair 10.4% |
| South Americans | 20.6 /100 | #203 | Fair 10.4% |
| Immigrants | Northern Europe | 19.5 /100 | #204 | Poor 10.4% |
| Cypriots | 18.9 /100 | #205 | Poor 10.4% |
| Immigrants | Europe | 18.5 /100 | #206 | Poor 10.4% |
| Immigrants | Honduras | 17.9 /100 | #207 | Poor 10.4% |
| Immigrants | Hong Kong | 17.6 /100 | #208 | Poor 10.5% |
| Peruvians | 17.2 /100 | #209 | Poor 10.5% |
| Immigrants | Belgium | 16.9 /100 | #210 | Poor 10.5% |
| Immigrants | Guatemala | 14.6 /100 | #211 | Poor 10.5% |
Demographics Similar to Indians (Asian) by Unemployment Among Ages 20 to 24 years
In terms of unemployment among ages 20 to 24 years, the demographic groups most similar to Indians (Asian) are Spaniard (10.3%, a difference of 0.030%), Immigrants from England (10.3%, a difference of 0.040%), Immigrants from Asia (10.3%, a difference of 0.050%), Estonian (10.3%, a difference of 0.060%), and Immigrants from Kazakhstan (10.2%, a difference of 0.11%).
| Demographics | Rating | Rank | Unemployment Among Ages 20 to 24 years |
| Immigrants | Switzerland | 71.3 /100 | #154 | Good 10.2% |
| Lithuanians | 70.0 /100 | #155 | Good 10.2% |
| Canadians | 66.7 /100 | #156 | Good 10.2% |
| Immigrants | Uganda | 65.6 /100 | #157 | Good 10.2% |
| Immigrants | Kazakhstan | 65.5 /100 | #158 | Good 10.2% |
| Immigrants | England | 63.7 /100 | #159 | Good 10.3% |
| Spaniards | 63.4 /100 | #160 | Good 10.3% |
| Indians (Asian) | 62.6 /100 | #161 | Good 10.3% |
| Immigrants | Asia | 61.3 /100 | #162 | Good 10.3% |
| Estonians | 61.1 /100 | #163 | Good 10.3% |
| Immigrants | Korea | 59.0 /100 | #164 | Average 10.3% |
| Lebanese | 58.3 /100 | #165 | Average 10.3% |
| Italians | 57.7 /100 | #166 | Average 10.3% |
| Immigrants | Fiji | 57.6 /100 | #167 | Average 10.3% |
| Iraqis | 56.7 /100 | #168 | Average 10.3% |