Immigrants from Northern Africa vs Immigrants from Pakistan Unemployment Among Ages 20 to 24 years
COMPARE
Immigrants from Northern Africa
Immigrants from Pakistan
Unemployment Among Ages 20 to 24 years
Unemployment Among Ages 20 to 24 years Comparison
Immigrants from Northern Africa
Immigrants from Pakistan
10.2%
UNEMPLOYMENT AMONG AGES 20 TO 24 YEARS
82.5/ 100
METRIC RATING
136th/ 347
METRIC RANK
10.6%
UNEMPLOYMENT AMONG AGES 20 TO 24 YEARS
2.6/ 100
METRIC RATING
238th/ 347
METRIC RANK
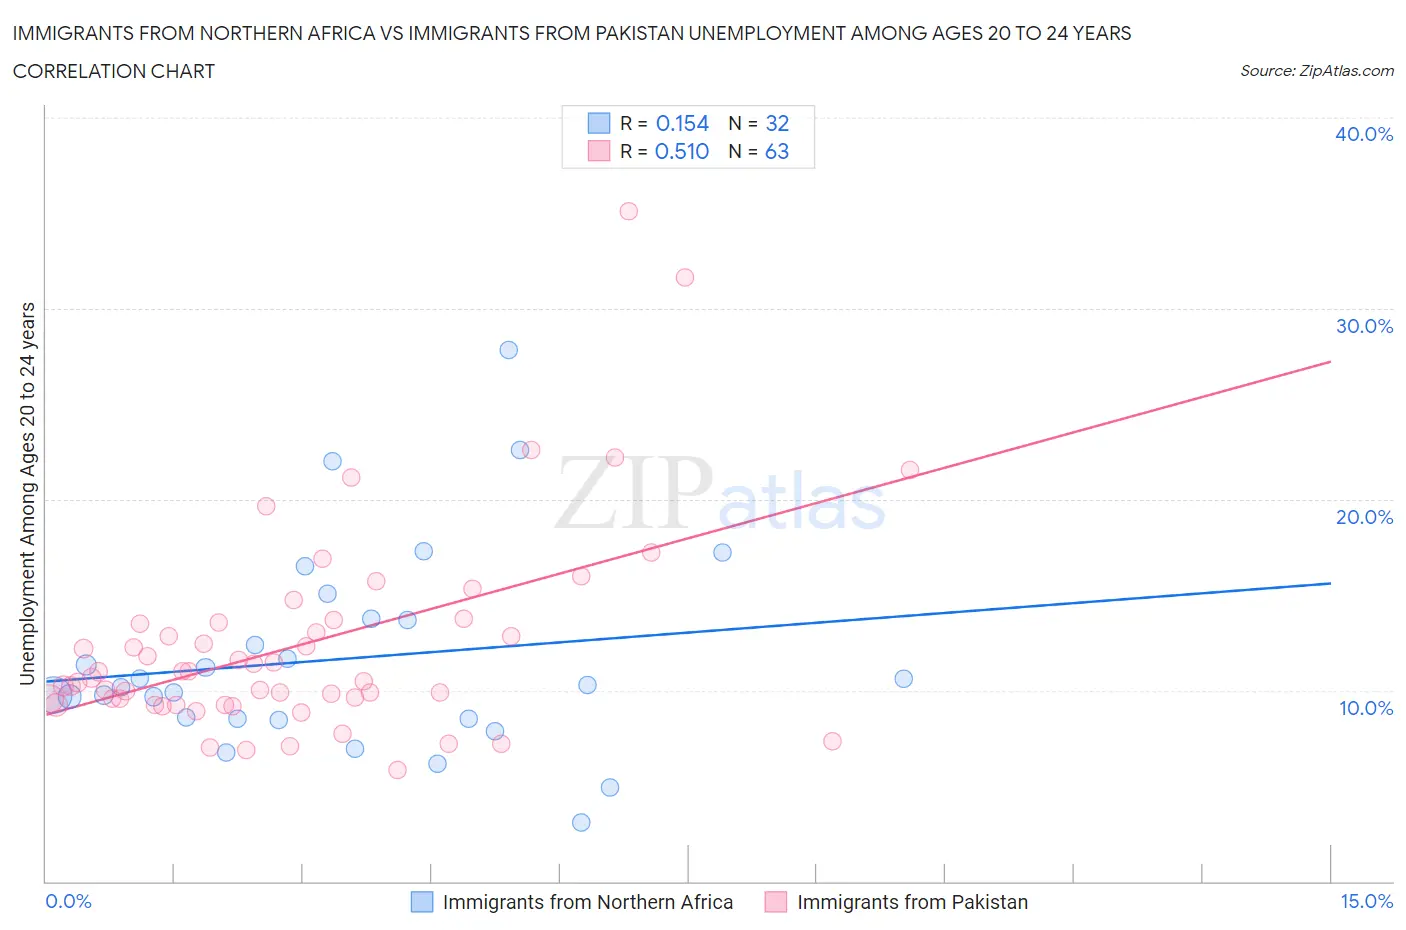
Immigrants from Northern Africa vs Immigrants from Pakistan Unemployment Among Ages 20 to 24 years Correlation Chart
The statistical analysis conducted on geographies consisting of 315,439,433 people shows a poor positive correlation between the proportion of Immigrants from Northern Africa and unemployment rate among population between the ages 20 and 24 in the United States with a correlation coefficient (R) of 0.154 and weighted average of 10.2%. Similarly, the statistical analysis conducted on geographies consisting of 279,854,860 people shows a substantial positive correlation between the proportion of Immigrants from Pakistan and unemployment rate among population between the ages 20 and 24 in the United States with a correlation coefficient (R) of 0.510 and weighted average of 10.6%, a difference of 4.8%.
Unemployment Among Ages 20 to 24 years Correlation Summary
| Measurement | Immigrants from Northern Africa | Immigrants from Pakistan |
| Minimum | 3.1% | 5.8% |
| Maximum | 27.8% | 35.1% |
| Range | 24.7% | 29.3% |
| Mean | 11.6% | 12.4% |
| Median | 10.2% | 10.6% |
| Interquartile 25% (IQ1) | 8.5% | 9.3% |
| Interquartile 75% (IQ3) | 13.7% | 13.5% |
| Interquartile Range (IQR) | 5.2% | 4.3% |
| Standard Deviation (Sample) | 5.3% | 5.4% |
| Standard Deviation (Population) | 5.2% | 5.4% |
Similar Demographics by Unemployment Among Ages 20 to 24 years
Demographics Similar to Immigrants from Northern Africa by Unemployment Among Ages 20 to 24 years
In terms of unemployment among ages 20 to 24 years, the demographic groups most similar to Immigrants from Northern Africa are Immigrants from North America (10.2%, a difference of 0.0%), Burmese (10.2%, a difference of 0.010%), Uruguayan (10.2%, a difference of 0.040%), Comanche (10.2%, a difference of 0.060%), and Immigrants from Austria (10.2%, a difference of 0.070%).
| Demographics | Rating | Rank | Unemployment Among Ages 20 to 24 years |
| Immigrants | South Central Asia | 84.6 /100 | #129 | Excellent 10.1% |
| Immigrants | Lithuania | 84.2 /100 | #130 | Excellent 10.1% |
| Seminole | 84.2 /100 | #131 | Excellent 10.1% |
| Immigrants | South Eastern Asia | 84.0 /100 | #132 | Excellent 10.1% |
| Austrians | 83.9 /100 | #133 | Excellent 10.2% |
| Romanians | 83.8 /100 | #134 | Excellent 10.2% |
| Comanche | 83.4 /100 | #135 | Excellent 10.2% |
| Immigrants | Northern Africa | 82.5 /100 | #136 | Excellent 10.2% |
| Immigrants | North America | 82.5 /100 | #137 | Excellent 10.2% |
| Burmese | 82.3 /100 | #138 | Excellent 10.2% |
| Uruguayans | 81.9 /100 | #139 | Excellent 10.2% |
| Immigrants | Austria | 81.4 /100 | #140 | Excellent 10.2% |
| Immigrants | Azores | 81.4 /100 | #141 | Excellent 10.2% |
| Slovaks | 80.2 /100 | #142 | Excellent 10.2% |
| Immigrants | Jordan | 79.0 /100 | #143 | Good 10.2% |
Demographics Similar to Immigrants from Pakistan by Unemployment Among Ages 20 to 24 years
In terms of unemployment among ages 20 to 24 years, the demographic groups most similar to Immigrants from Pakistan are Immigrants (10.6%, a difference of 0.020%), Salvadoran (10.7%, a difference of 0.060%), Mexican (10.6%, a difference of 0.19%), Immigrants from Ukraine (10.6%, a difference of 0.23%), and Immigrants from Central America (10.7%, a difference of 0.25%).
| Demographics | Rating | Rank | Unemployment Among Ages 20 to 24 years |
| Native Hawaiians | 3.9 /100 | #231 | Tragic 10.6% |
| Israelis | 3.7 /100 | #232 | Tragic 10.6% |
| Choctaw | 3.6 /100 | #233 | Tragic 10.6% |
| Immigrants | Africa | 3.5 /100 | #234 | Tragic 10.6% |
| Immigrants | Ukraine | 3.3 /100 | #235 | Tragic 10.6% |
| Mexicans | 3.2 /100 | #236 | Tragic 10.6% |
| Immigrants | Immigrants | 2.7 /100 | #237 | Tragic 10.6% |
| Immigrants | Pakistan | 2.6 /100 | #238 | Tragic 10.6% |
| Salvadorans | 2.4 /100 | #239 | Tragic 10.7% |
| Immigrants | Central America | 2.0 /100 | #240 | Tragic 10.7% |
| Immigrants | El Salvador | 1.7 /100 | #241 | Tragic 10.7% |
| Moroccans | 1.4 /100 | #242 | Tragic 10.7% |
| Immigrants | Belarus | 1.3 /100 | #243 | Tragic 10.7% |
| Immigrants | Mexico | 1.2 /100 | #244 | Tragic 10.7% |
| Hispanics or Latinos | 1.0 /100 | #245 | Tragic 10.7% |