Immigrants from North Macedonia vs Immigrants from Thailand Unemployment Among Ages 60 to 64 years
COMPARE
Immigrants from North Macedonia
Immigrants from Thailand
Unemployment Among Ages 60 to 64 years
Unemployment Among Ages 60 to 64 years Comparison
Immigrants from North Macedonia
Immigrants from Thailand
5.0%
UNEMPLOYMENT AMONG AGES 60 TO 64 YEARS
1.1/ 100
METRIC RATING
247th/ 347
METRIC RANK
4.7%
UNEMPLOYMENT AMONG AGES 60 TO 64 YEARS
93.7/ 100
METRIC RATING
125th/ 347
METRIC RANK
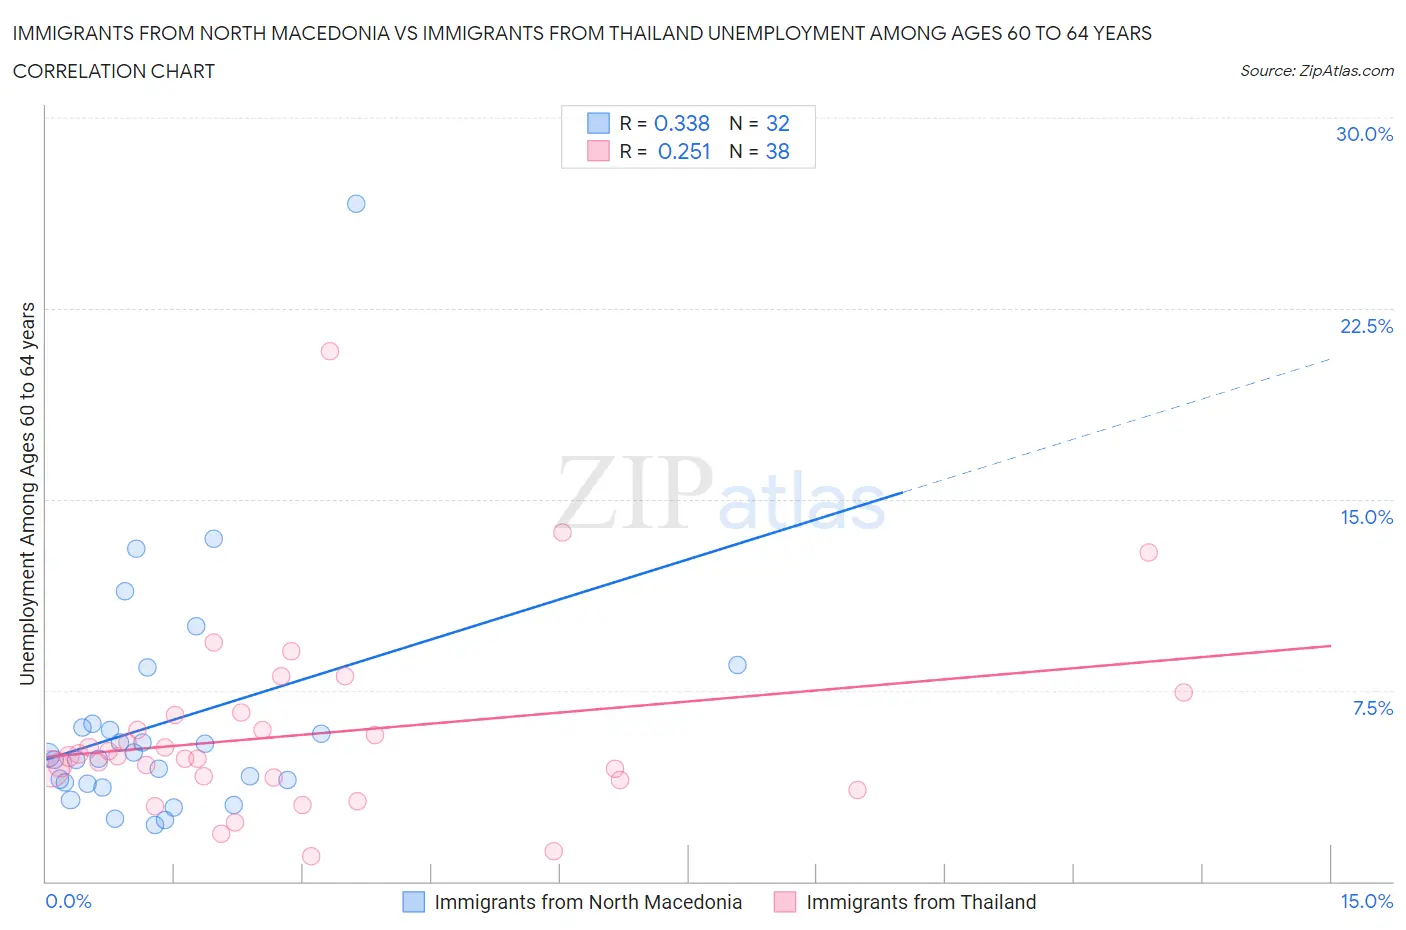
Immigrants from North Macedonia vs Immigrants from Thailand Unemployment Among Ages 60 to 64 years Correlation Chart
The statistical analysis conducted on geographies consisting of 72,412,869 people shows a mild positive correlation between the proportion of Immigrants from North Macedonia and unemployment rate among population between the ages 60 and 64 in the United States with a correlation coefficient (R) of 0.338 and weighted average of 5.0%. Similarly, the statistical analysis conducted on geographies consisting of 294,949,479 people shows a weak positive correlation between the proportion of Immigrants from Thailand and unemployment rate among population between the ages 60 and 64 in the United States with a correlation coefficient (R) of 0.251 and weighted average of 4.7%, a difference of 6.5%.
Unemployment Among Ages 60 to 64 years Correlation Summary
| Measurement | Immigrants from North Macedonia | Immigrants from Thailand |
| Minimum | 2.2% | 0.96% |
| Maximum | 26.6% | 20.8% |
| Range | 24.4% | 19.8% |
| Mean | 6.3% | 5.8% |
| Median | 4.9% | 4.9% |
| Interquartile 25% (IQ1) | 3.9% | 4.1% |
| Interquartile 75% (IQ3) | 6.1% | 6.5% |
| Interquartile Range (IQR) | 2.3% | 2.5% |
| Standard Deviation (Sample) | 4.7% | 3.7% |
| Standard Deviation (Population) | 4.6% | 3.6% |
Similar Demographics by Unemployment Among Ages 60 to 64 years
Demographics Similar to Immigrants from North Macedonia by Unemployment Among Ages 60 to 64 years
In terms of unemployment among ages 60 to 64 years, the demographic groups most similar to Immigrants from North Macedonia are Immigrants from South America (5.0%, a difference of 0.0%), Immigrants from Fiji (5.1%, a difference of 0.050%), South American (5.1%, a difference of 0.080%), Comanche (5.0%, a difference of 0.13%), and Immigrants from Cambodia (5.1%, a difference of 0.17%).
| Demographics | Rating | Rank | Unemployment Among Ages 60 to 64 years |
| Immigrants | Croatia | 2.2 /100 | #240 | Tragic 5.0% |
| Indians (Asian) | 2.2 /100 | #241 | Tragic 5.0% |
| Argentineans | 2.1 /100 | #242 | Tragic 5.0% |
| Immigrants | Philippines | 1.9 /100 | #243 | Tragic 5.0% |
| Peruvians | 1.6 /100 | #244 | Tragic 5.0% |
| Comanche | 1.3 /100 | #245 | Tragic 5.0% |
| Immigrants | South America | 1.1 /100 | #246 | Tragic 5.0% |
| Immigrants | North Macedonia | 1.1 /100 | #247 | Tragic 5.0% |
| Immigrants | Fiji | 1.1 /100 | #248 | Tragic 5.1% |
| South Americans | 1.0 /100 | #249 | Tragic 5.1% |
| Immigrants | Cambodia | 0.9 /100 | #250 | Tragic 5.1% |
| Immigrants | Uruguay | 0.9 /100 | #251 | Tragic 5.1% |
| Immigrants | Switzerland | 0.9 /100 | #252 | Tragic 5.1% |
| Immigrants | China | 0.9 /100 | #253 | Tragic 5.1% |
| Costa Ricans | 0.8 /100 | #254 | Tragic 5.1% |
Demographics Similar to Immigrants from Thailand by Unemployment Among Ages 60 to 64 years
In terms of unemployment among ages 60 to 64 years, the demographic groups most similar to Immigrants from Thailand are Immigrants from South Central Asia (4.7%, a difference of 0.10%), Immigrants from Senegal (4.7%, a difference of 0.14%), Finnish (4.7%, a difference of 0.17%), Austrian (4.8%, a difference of 0.24%), and Immigrants from Kazakhstan (4.7%, a difference of 0.25%).
| Demographics | Rating | Rank | Unemployment Among Ages 60 to 64 years |
| Ukrainians | 96.1 /100 | #118 | Exceptional 4.7% |
| Immigrants | Morocco | 95.7 /100 | #119 | Exceptional 4.7% |
| Macedonians | 95.7 /100 | #120 | Exceptional 4.7% |
| Albanians | 95.3 /100 | #121 | Exceptional 4.7% |
| Immigrants | Kazakhstan | 95.1 /100 | #122 | Exceptional 4.7% |
| Finns | 94.7 /100 | #123 | Exceptional 4.7% |
| Immigrants | Senegal | 94.5 /100 | #124 | Exceptional 4.7% |
| Immigrants | Thailand | 93.7 /100 | #125 | Exceptional 4.7% |
| Immigrants | South Central Asia | 93.0 /100 | #126 | Exceptional 4.7% |
| Austrians | 91.9 /100 | #127 | Exceptional 4.8% |
| Choctaw | 90.3 /100 | #128 | Exceptional 4.8% |
| Immigrants | Serbia | 90.2 /100 | #129 | Exceptional 4.8% |
| Immigrants | Syria | 90.1 /100 | #130 | Exceptional 4.8% |
| Immigrants | Lebanon | 89.6 /100 | #131 | Excellent 4.8% |
| Lithuanians | 89.6 /100 | #132 | Excellent 4.8% |