Immigrants from North America vs Immigrants from Morocco Unemployment Among Ages 65 to 74 years

COMPARE

Immigrants from North America
Race
Ancestry
AfghanAfricanAlaska NativeAlaskan AthabascanAlbanianAleutAlsatianAmericanApacheArabArapahoArgentineanArmenianAssyrian/Chaldean/SyriacAustralianAustrianBahamianBangladeshiBarbadianBasqueBelgianBelizeanBermudanBhutaneseBlackfeetBolivianBrazilianBritishBritish West IndianBulgarianBurmeseCajunCambodianCanadianCape VerdeanCarpatho RusynCelticCentral AmericanCentral American IndianCherokeeCheyenneChickasawChileanChineseChippewaChoctawColombianColvilleComancheCosta RicanCreeCreekCroatianCrowCubanCypriotCzechCzechoslovakianDanishDelawareDominicanDutchDutch West IndianEastern EuropeanEcuadorianEgyptianEnglishEstonianEthiopianEuropeanFijianFilipinoFinnishFrenchFrench American IndianFrench CanadianGermanGerman RussianGhanaianGreekGuamanian/ChamorroGuatemalanGuyaneseHaitianHmongHonduranHopiHoumaHungarianIcelanderIndian (Asian)IndonesianInupiatIranianIraqiIrishIroquoisIsraeliItalianJamaicanJapaneseJordanianKenyanKiowaKoreanLaotianLatvianLebaneseLiberianLithuanianLumbeeLuxembourgerMacedonianMalaysianMalteseMarshalleseMenomineeMexicanMexican American IndianMongolianMoroccanNative HawaiianNavajoNepaleseNew ZealanderNicaraguanNigerianNorthern EuropeanNorwegianOkinawanOsageOttawaPaiutePakistaniPalestinianPanamanianParaguayanPennsylvania GermanPeruvianPimaPolishPortuguesePotawatomiPuebloPuerto RicanPuget Sound SalishRomanianRussianSalvadoranSamoanScandinavianScotch-IrishScottishSeminoleSenegaleseSerbianShoshoneSierra LeoneanSiouxSlavicSlovakSloveneSomaliSouth AfricanSouth AmericanSouth American IndianSoviet UnionSpaniardSpanishSpanish AmericanSpanish American IndianSri LankanSubsaharan AfricanSudaneseSwedishSwissSyrianTaiwaneseThaiTlingit-HaidaTohono O'OdhamTonganTrinidadian and TobagonianTsimshianTurkishU.S. Virgin IslanderUgandanUkrainianUruguayanUteVenezuelanVietnameseWelshWest IndianYakamaYaquiYugoslavianYumanYup'ikZimbabwean
Immigration
NonimmigrantsImmigrantsAfghanistanAfricaAlbaniaArgentinaArmeniaAsiaAustraliaAustriaBahamasBangladeshBarbadosBelarusBelgiumBelizeBoliviaBosnia and HerzegovinaBrazilBulgariaBurma/MyanmarCabo VerdeCambodiaCameroonCanadaCaribbeanCentral AmericaChileChinaColombiaCongoCosta RicaCroatiaCubaCzechoslovakiaDenmarkDominicaDominican RepublicEastern AfricaEastern AsiaEastern EuropeEcuadorEgyptEl SalvadorEnglandEritreaEthiopiaEuropeFijiFranceGermanyGhanaGreeceGrenadaGuatemalaGuyanaHaitiHondurasHong KongHungaryIndiaIndonesiaIranIraqIrelandIsraelItalyJamaicaJapanJordanKazakhstanKenyaKoreaKuwaitLaosLatin AmericaLatviaLebanonLiberiaLithuaniaMalaysiaMexicoMicronesiaMiddle AfricaMoldovaNepalNetherlandsNicaraguaNigeriaNorth AmericaNorth MacedoniaNorthern AfricaNorthern EuropeNorwayOceaniaPakistanPanamaPeruPhilippinesPolandPortugalRomaniaRussiaSaudi ArabiaScotlandSenegalSerbiaSierra LeoneSingaporeSomaliaSouth AfricaSouth AmericaSouth Central AsiaSouth Eastern AsiaSouthern EuropeSpainSri LankaSt. Vincent and the GrenadinesSudanSwedenSwitzerlandSyriaTaiwanThailandTrinidad and TobagoTurkeyUgandaUkraineUruguayUzbekistanVenezuelaVietnamWest IndiesWestern AfricaWestern AsiaWestern EuropeYemenZaireZimbabweAzores
Immigrants from Morocco
Race
Ancestry
AfghanAfricanAlaska NativeAlaskan AthabascanAlbanianAleutAlsatianAmericanApacheArabArapahoArgentineanArmenianAssyrian/Chaldean/SyriacAustralianAustrianBahamianBangladeshiBarbadianBasqueBelgianBelizeanBermudanBhutaneseBlackfeetBolivianBrazilianBritishBritish West IndianBulgarianBurmeseCajunCambodianCanadianCape VerdeanCarpatho RusynCelticCentral AmericanCentral American IndianCherokeeCheyenneChickasawChileanChineseChippewaChoctawColombianColvilleComancheCosta RicanCreeCreekCroatianCrowCubanCypriotCzechCzechoslovakianDanishDelawareDominicanDutchDutch West IndianEastern EuropeanEcuadorianEgyptianEnglishEstonianEthiopianEuropeanFijianFilipinoFinnishFrenchFrench American IndianFrench CanadianGermanGerman RussianGhanaianGreekGuamanian/ChamorroGuatemalanGuyaneseHaitianHmongHonduranHopiHoumaHungarianIcelanderIndian (Asian)IndonesianInupiatIranianIraqiIrishIroquoisIsraeliItalianJamaicanJapaneseJordanianKenyanKiowaKoreanLaotianLatvianLebaneseLiberianLithuanianLumbeeLuxembourgerMacedonianMalaysianMalteseMarshalleseMenomineeMexicanMexican American IndianMongolianMoroccanNative HawaiianNavajoNepaleseNew ZealanderNicaraguanNigerianNorthern EuropeanNorwegianOkinawanOsageOttawaPaiutePakistaniPalestinianPanamanianParaguayanPennsylvania GermanPeruvianPimaPolishPortuguesePotawatomiPuebloPuerto RicanPuget Sound SalishRomanianRussianSalvadoranSamoanScandinavianScotch-IrishScottishSeminoleSenegaleseSerbianShoshoneSierra LeoneanSiouxSlavicSlovakSloveneSomaliSouth AfricanSouth AmericanSouth American IndianSoviet UnionSpaniardSpanishSpanish AmericanSpanish American IndianSri LankanSubsaharan AfricanSudaneseSwedishSwissSyrianTaiwaneseThaiTlingit-HaidaTohono O'OdhamTonganTrinidadian and TobagonianTsimshianTurkishU.S. Virgin IslanderUgandanUkrainianUruguayanUteVenezuelanVietnameseWelshWest IndianYakamaYaquiYugoslavianYumanYup'ikZimbabwean
Immigration
NonimmigrantsImmigrantsAfghanistanAfricaAlbaniaArgentinaArmeniaAsiaAustraliaAustriaBahamasBangladeshBarbadosBelarusBelgiumBelizeBoliviaBosnia and HerzegovinaBrazilBulgariaBurma/MyanmarCabo VerdeCambodiaCameroonCanadaCaribbeanCentral AmericaChileChinaColombiaCongoCosta RicaCroatiaCubaCzechoslovakiaDenmarkDominicaDominican RepublicEastern AfricaEastern AsiaEastern EuropeEcuadorEgyptEl SalvadorEnglandEritreaEthiopiaEuropeFijiFranceGermanyGhanaGreeceGrenadaGuatemalaGuyanaHaitiHondurasHong KongHungaryIndiaIndonesiaIranIraqIrelandIsraelItalyJamaicaJapanJordanKazakhstanKenyaKoreaKuwaitLaosLatin AmericaLatviaLebanonLiberiaLithuaniaMalaysiaMexicoMicronesiaMiddle AfricaMoldovaMoroccoNepalNetherlandsNicaraguaNigeriaNorth MacedoniaNorthern AfricaNorthern EuropeNorwayOceaniaPakistanPanamaPeruPhilippinesPolandPortugalRomaniaRussiaSaudi ArabiaScotlandSenegalSerbiaSierra LeoneSingaporeSomaliaSouth AfricaSouth AmericaSouth Central AsiaSouth Eastern AsiaSouthern EuropeSpainSri LankaSt. Vincent and the GrenadinesSudanSwedenSwitzerlandSyriaTaiwanThailandTrinidad and TobagoTurkeyUgandaUkraineUruguayUzbekistanVenezuelaVietnamWest IndiesWestern AfricaWestern AsiaWestern EuropeYemenZaireZimbabweAzores
Unemployment Among Ages 65 to 74 years
Income
Poverty
Unemployment
Labor Participation
Family Structure
Vehicle Availability
Education Level
Disability

Unemployment Among Ages 65 to 74 years Comparison

Immigrants from North America

Immigrants from Morocco

Excellent
Tragic
5.3%
UNEMPLOYMENT AMONG AGES 65 TO 74 YEARS
86.7/ 100
METRIC RATING
127th/ 347
METRIC RANK
5.8%
UNEMPLOYMENT AMONG AGES 65 TO 74 YEARS
0.0/ 100
METRIC RATING
294th/ 347
METRIC RANK

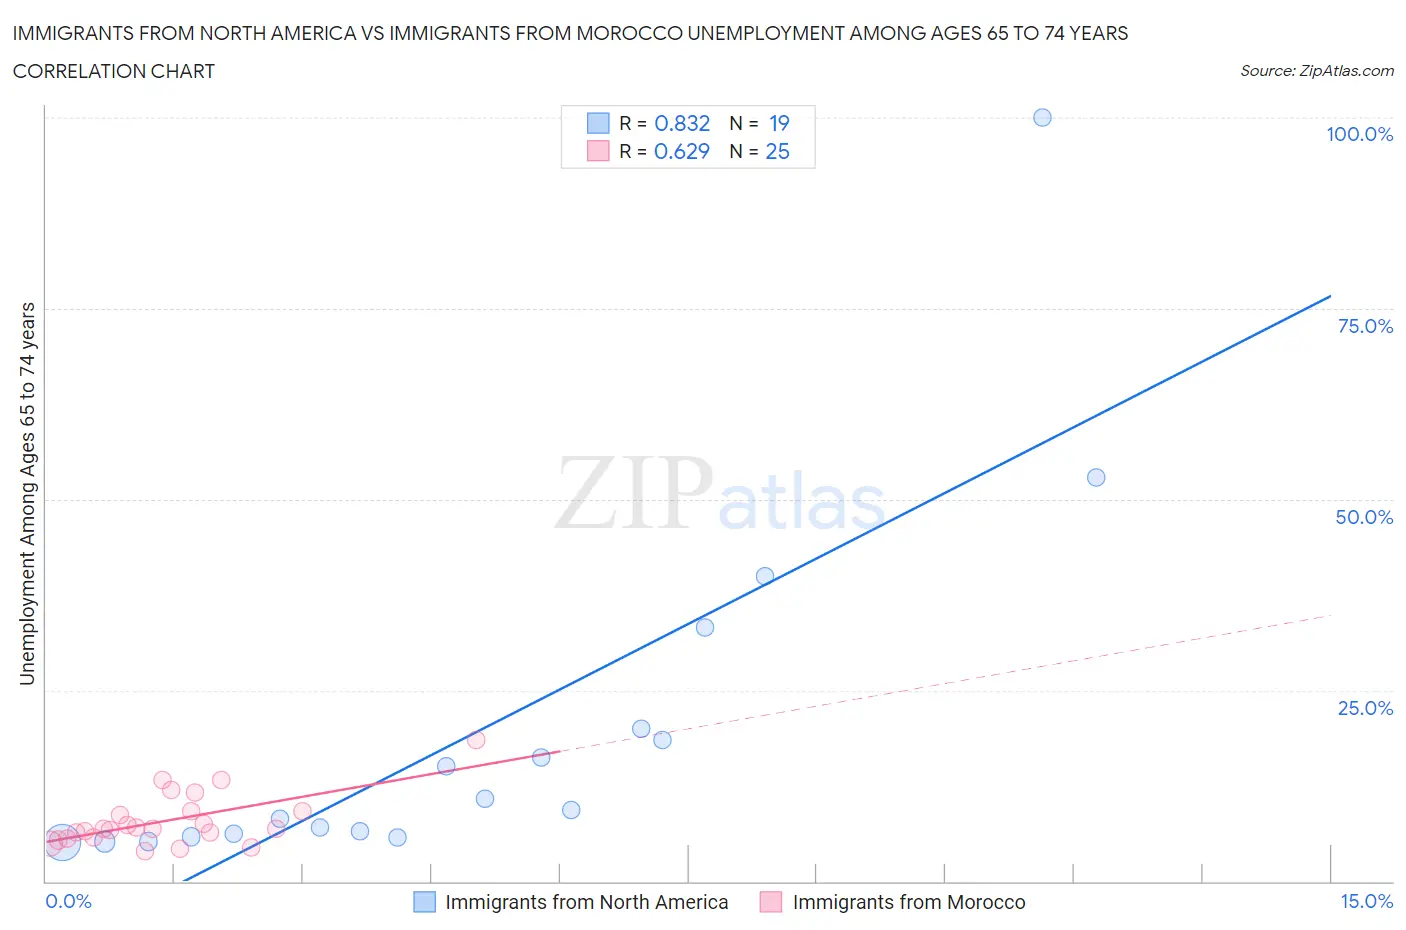
Immigrants from North America vs Immigrants from Morocco Unemployment Among Ages 65 to 74 years Correlation Chart

The statistical analysis conducted on geographies consisting of 393,253,600 people shows a very strong positive correlation between the proportion of Immigrants from North America and unemployment rate among population between the ages 65 and 74 in the United States with a correlation coefficient (R) of 0.832 and weighted average of 5.3%. Similarly, the statistical analysis conducted on geographies consisting of 169,573,409 people shows a significant positive correlation between the proportion of Immigrants from Morocco and unemployment rate among population between the ages 65 and 74 in the United States with a correlation coefficient (R) of 0.629 and weighted average of 5.8%, a difference of 9.2%.
Immigrants from North America vs Immigrants from Morocco Unemployment Among Ages 65 to 74 years

Unemployment Among Ages 65 to 74 years Correlation Summary

MeasurementImmigrants from North AmericaImmigrants from Morocco
Minimum5.1%3.9%
Maximum100.0%18.5%
Range94.9%14.6%
Mean19.5%7.9%
Median9.3%6.8%
Interquartile 25% (IQ1)5.8%5.7%
Interquartile 75% (IQ3)20.0%9.1%
Interquartile Range (IQR)14.2%3.4%
Standard Deviation (Sample)23.6%3.4%
Standard Deviation (Population)23.0%3.4%

Similar Demographics by Unemployment Among Ages 65 to 74 years

Demographics Similar to Immigrants from North America by Unemployment Among Ages 65 to 74 years

In terms of unemployment among ages 65 to 74 years, the demographic groups most similar to Immigrants from North America are Immigrants from Hong Kong (5.3%, a difference of 0.010%), Immigrants from South Eastern Asia (5.3%, a difference of 0.040%), Immigrants from England (5.3%, a difference of 0.040%), Pakistani (5.3%, a difference of 0.060%), and Immigrants from Ukraine (5.3%, a difference of 0.070%).
DemographicsRating | RankUnemployment Among Ages 65 to 74 years
Immigrants | Switzerland
89.9
/100
|
#120
Excellent
5.3%
Immigrants | Australia
89.1
/100
|
#121
Excellent
5.3%
Immigrants | Canada
89.0
/100
|
#122
Excellent
5.3%
Czechoslovakians
88.6
/100
|
#123
Excellent
5.3%
Immigrants | Ukraine
87.5
/100
|
#124
Excellent
5.3%
Pakistanis
87.5
/100
|
#125
Excellent
5.3%
Immigrants | South Eastern Asia
87.2
/100
|
#126
Excellent
5.3%
Immigrants | North America
86.7
/100
|
#127
Excellent
5.3%
Immigrants | Hong Kong
86.5
/100
|
#128
Excellent
5.3%
Immigrants | England
86.2
/100
|
#129
Excellent
5.3%
Eastern Europeans
85.6
/100
|
#130
Excellent
5.3%
Immigrants | Russia
83.0
/100
|
#131
Excellent
5.3%
Koreans
82.6
/100
|
#132
Excellent
5.3%
Ukrainians
82.0
/100
|
#133
Excellent
5.3%
Immigrants | Panama
81.8
/100
|
#134
Excellent
5.3%

Demographics Similar to Immigrants from Morocco by Unemployment Among Ages 65 to 74 years

In terms of unemployment among ages 65 to 74 years, the demographic groups most similar to Immigrants from Morocco are Immigrants from Grenada (5.8%, a difference of 0.030%), Black/African American (5.8%, a difference of 0.030%), U.S. Virgin Islander (5.8%, a difference of 0.13%), Portuguese (5.7%, a difference of 0.35%), and Spanish American Indian (5.7%, a difference of 0.38%).
DemographicsRating | RankUnemployment Among Ages 65 to 74 years
Central American Indians
0.0
/100
|
#287
Tragic
5.7%
Central Americans
0.0
/100
|
#288
Tragic
5.7%
Immigrants | Somalia
0.0
/100
|
#289
Tragic
5.7%
Spanish American Indians
0.0
/100
|
#290
Tragic
5.7%
Portuguese
0.0
/100
|
#291
Tragic
5.7%
U.S. Virgin Islanders
0.0
/100
|
#292
Tragic
5.8%
Immigrants | Grenada
0.0
/100
|
#293
Tragic
5.8%
Immigrants | Morocco
0.0
/100
|
#294
Tragic
5.8%
Blacks/African Americans
0.0
/100
|
#295
Tragic
5.8%
Pennsylvania Germans
0.0
/100
|
#296
Tragic
5.8%
Houma
0.0
/100
|
#297
Tragic
5.8%
Immigrants | Latin America
0.0
/100
|
#298
Tragic
5.8%
Barbadians
0.0
/100
|
#299
Tragic
5.8%
Ecuadorians
0.0
/100
|
#300
Tragic
5.8%
Armenians
0.0
/100
|
#301
Tragic
5.8%