Immigrants from Nigeria vs Immigrants from El Salvador Unemployment Among Youth under 25 years
COMPARE
Immigrants from Nigeria
Immigrants from El Salvador
Unemployment Among Youth under 25 years
Unemployment Among Youth under 25 years Comparison
Immigrants from Nigeria
Immigrants from El Salvador
13.0%
UNEMPLOYMENT AMONG YOUTH UNDER 25 YEARS
0.0/ 100
METRIC RATING
274th/ 347
METRIC RANK
12.4%
UNEMPLOYMENT AMONG YOUTH UNDER 25 YEARS
0.1/ 100
METRIC RATING
261st/ 347
METRIC RANK
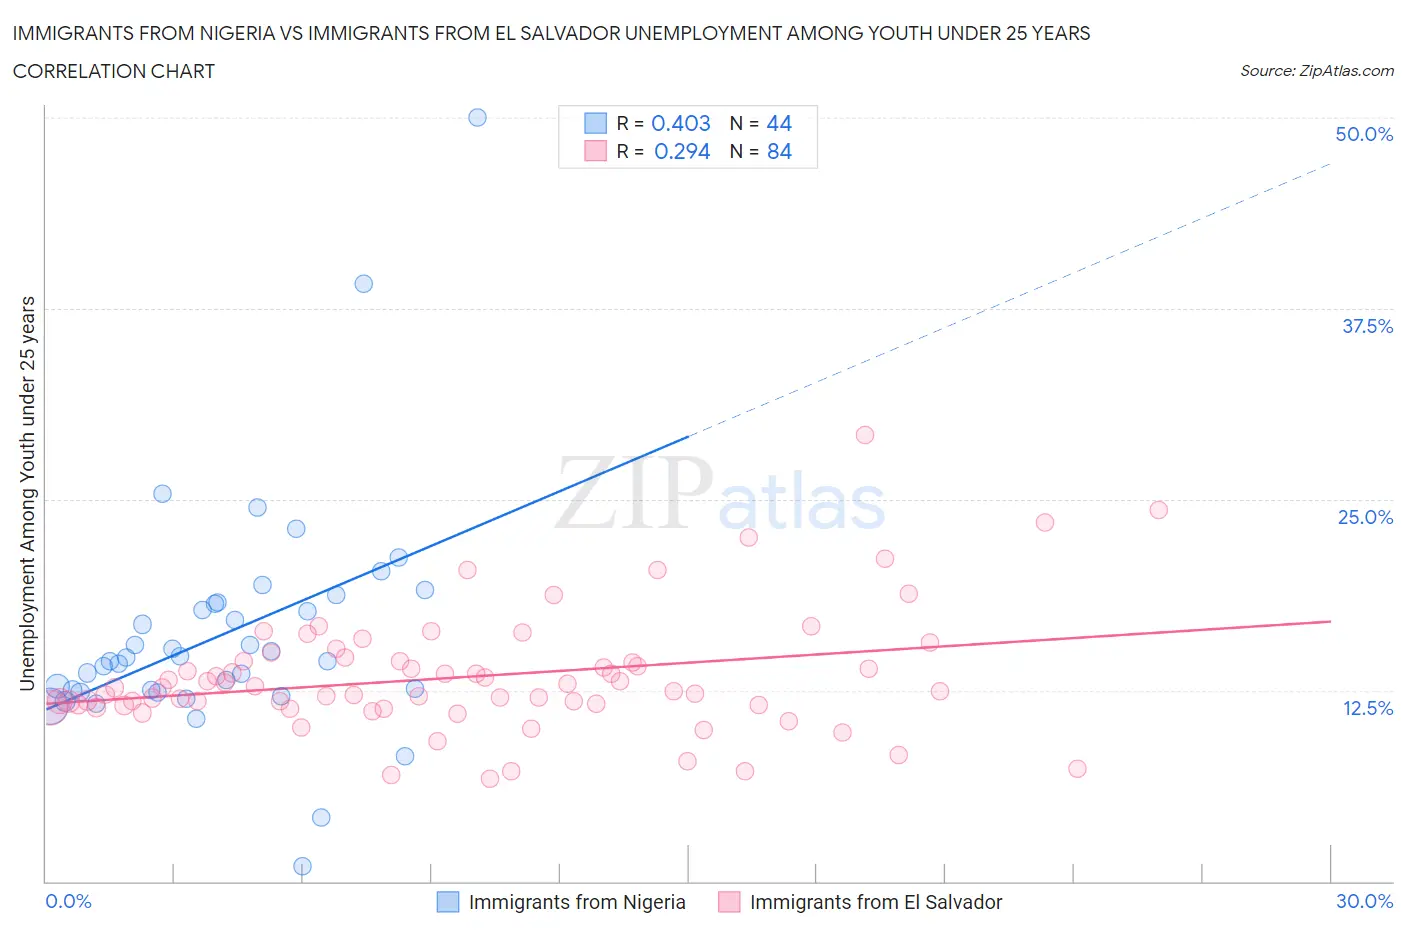
Immigrants from Nigeria vs Immigrants from El Salvador Unemployment Among Youth under 25 years Correlation Chart
The statistical analysis conducted on geographies consisting of 282,132,843 people shows a moderate positive correlation between the proportion of Immigrants from Nigeria and unemployment rate among youth under the age of 25 in the United States with a correlation coefficient (R) of 0.403 and weighted average of 13.0%. Similarly, the statistical analysis conducted on geographies consisting of 354,363,061 people shows a weak positive correlation between the proportion of Immigrants from El Salvador and unemployment rate among youth under the age of 25 in the United States with a correlation coefficient (R) of 0.294 and weighted average of 12.4%, a difference of 4.9%.
Unemployment Among Youth under 25 years Correlation Summary
| Measurement | Immigrants from Nigeria | Immigrants from El Salvador |
| Minimum | 1.0% | 6.7% |
| Maximum | 50.0% | 29.2% |
| Range | 49.0% | 22.4% |
| Mean | 16.2% | 13.4% |
| Median | 14.6% | 12.6% |
| Interquartile 25% (IQ1) | 12.5% | 11.5% |
| Interquartile 75% (IQ3) | 18.2% | 14.4% |
| Interquartile Range (IQR) | 5.7% | 2.9% |
| Standard Deviation (Sample) | 7.8% | 3.9% |
| Standard Deviation (Population) | 7.7% | 3.9% |
Demographics Similar to Immigrants from Nigeria and Immigrants from El Salvador by Unemployment Among Youth under 25 years
In terms of unemployment among youth under 25 years, the demographic groups most similar to Immigrants from Nigeria are Bermudan (13.0%, a difference of 0.11%), Immigrants from Uzbekistan (13.1%, a difference of 0.54%), Nigerian (13.0%, a difference of 0.58%), Bahamian (13.1%, a difference of 0.71%), and Cape Verdean (12.9%, a difference of 0.93%). Similarly, the demographic groups most similar to Immigrants from El Salvador are Immigrants from Panama (12.4%, a difference of 0.010%), Immigrants from Mexico (12.4%, a difference of 0.050%), Cree (12.4%, a difference of 0.14%), Immigrants from Central America (12.4%, a difference of 0.31%), and Salvadoran (12.4%, a difference of 0.37%).
| Demographics | Rating | Rank | Unemployment Among Youth under 25 years |
| Panamanians | 0.2 /100 | #257 | Tragic 12.4% |
| Salvadorans | 0.1 /100 | #258 | Tragic 12.4% |
| Immigrants | Central America | 0.1 /100 | #259 | Tragic 12.4% |
| Immigrants | Panama | 0.1 /100 | #260 | Tragic 12.4% |
| Immigrants | El Salvador | 0.1 /100 | #261 | Tragic 12.4% |
| Immigrants | Mexico | 0.1 /100 | #262 | Tragic 12.4% |
| Cree | 0.1 /100 | #263 | Tragic 12.4% |
| Puget Sound Salish | 0.1 /100 | #264 | Tragic 12.5% |
| Nepalese | 0.0 /100 | #265 | Tragic 12.5% |
| Immigrants | Latin America | 0.0 /100 | #266 | Tragic 12.6% |
| Sub-Saharan Africans | 0.0 /100 | #267 | Tragic 12.6% |
| Tlingit-Haida | 0.0 /100 | #268 | Tragic 12.7% |
| Kiowa | 0.0 /100 | #269 | Tragic 12.7% |
| Immigrants | Liberia | 0.0 /100 | #270 | Tragic 12.8% |
| Immigrants | Bahamas | 0.0 /100 | #271 | Tragic 12.9% |
| Cape Verdeans | 0.0 /100 | #272 | Tragic 12.9% |
| Nigerians | 0.0 /100 | #273 | Tragic 13.0% |
| Immigrants | Nigeria | 0.0 /100 | #274 | Tragic 13.0% |
| Bermudans | 0.0 /100 | #275 | Tragic 13.0% |
| Immigrants | Uzbekistan | 0.0 /100 | #276 | Tragic 13.1% |
| Bahamians | 0.0 /100 | #277 | Tragic 13.1% |