Immigrants from Nicaragua vs Bulgarian Unemployment Among Women with Children Under 6 years
COMPARE
Immigrants from Nicaragua
Bulgarian
Unemployment Among Women with Children Under 6 years
Unemployment Among Women with Children Under 6 years Comparison
Immigrants from Nicaragua
Bulgarians
7.2%
UNEMPLOYMENT AMONG WOMEN WITH CHILDREN UNDER 6 YEARS
97.3/ 100
METRIC RATING
102nd/ 347
METRIC RANK
6.5%
UNEMPLOYMENT AMONG WOMEN WITH CHILDREN UNDER 6 YEARS
100.0/ 100
METRIC RATING
23rd/ 347
METRIC RANK
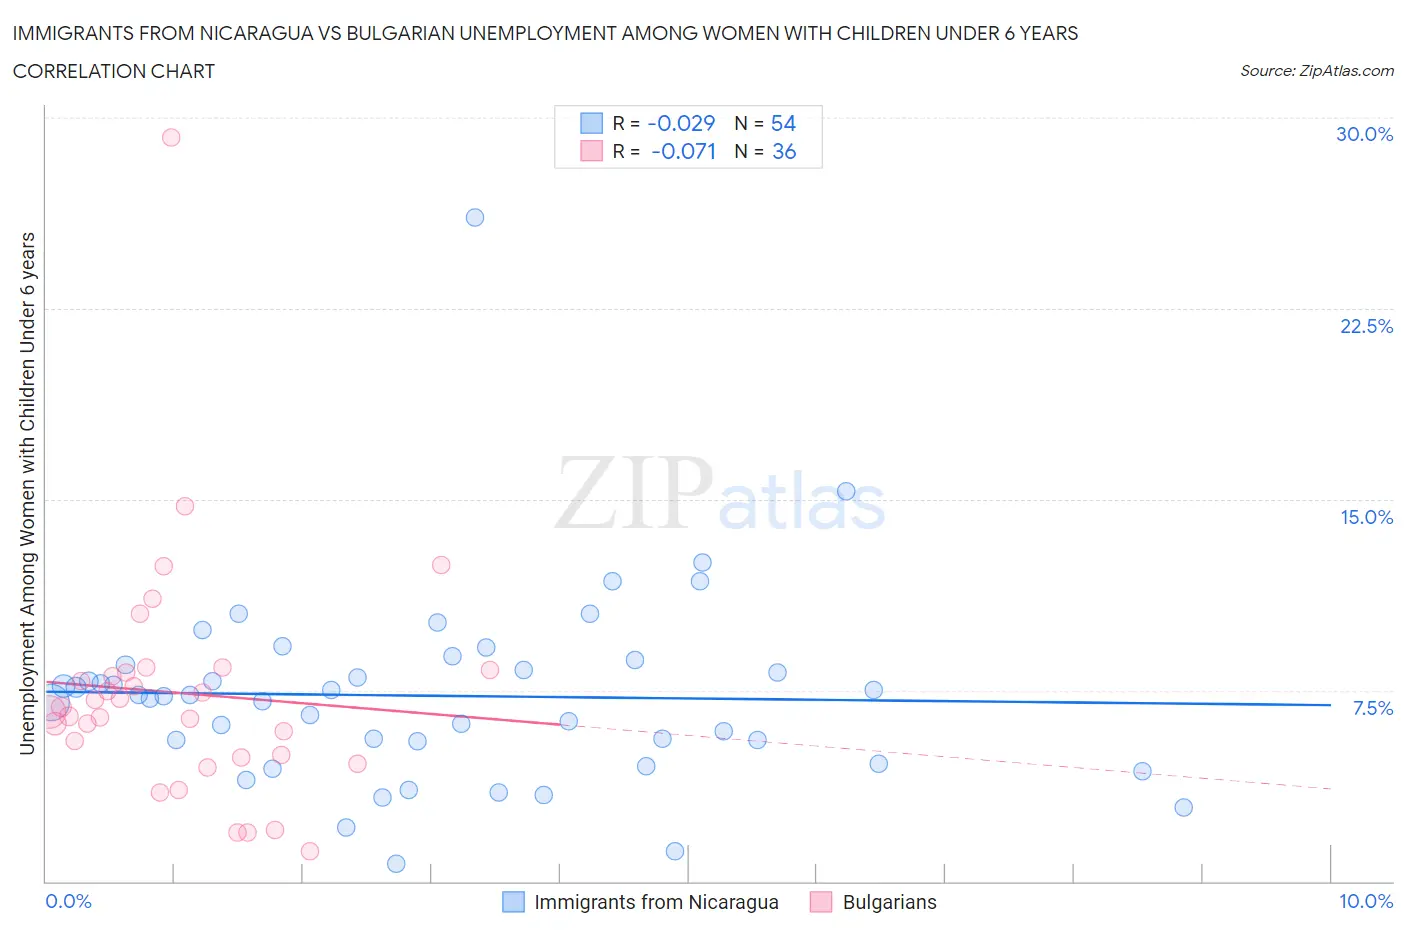
Immigrants from Nicaragua vs Bulgarian Unemployment Among Women with Children Under 6 years Correlation Chart
The statistical analysis conducted on geographies consisting of 200,218,273 people shows no correlation between the proportion of Immigrants from Nicaragua and unemployment rate among women with children under the age of 6 in the United States with a correlation coefficient (R) of -0.029 and weighted average of 7.2%. Similarly, the statistical analysis conducted on geographies consisting of 170,221,642 people shows a slight negative correlation between the proportion of Bulgarians and unemployment rate among women with children under the age of 6 in the United States with a correlation coefficient (R) of -0.071 and weighted average of 6.5%, a difference of 10.3%.
Unemployment Among Women with Children Under 6 years Correlation Summary
| Measurement | Immigrants from Nicaragua | Bulgarian |
| Minimum | 0.70% | 1.2% |
| Maximum | 26.1% | 29.2% |
| Range | 25.4% | 28.0% |
| Mean | 7.3% | 7.4% |
| Median | 7.3% | 6.7% |
| Interquartile 25% (IQ1) | 5.5% | 4.9% |
| Interquartile 75% (IQ3) | 8.5% | 8.3% |
| Interquartile Range (IQR) | 3.0% | 3.4% |
| Standard Deviation (Sample) | 3.9% | 4.8% |
| Standard Deviation (Population) | 3.8% | 4.7% |
Similar Demographics by Unemployment Among Women with Children Under 6 years
Demographics Similar to Immigrants from Nicaragua by Unemployment Among Women with Children Under 6 years
In terms of unemployment among women with children under 6 years, the demographic groups most similar to Immigrants from Nicaragua are Immigrants from Saudi Arabia (7.2%, a difference of 0.0%), Chilean (7.2%, a difference of 0.030%), Immigrants from Northern Europe (7.2%, a difference of 0.050%), Immigrants from Egypt (7.2%, a difference of 0.080%), and Venezuelan (7.2%, a difference of 0.090%).
| Demographics | Rating | Rank | Unemployment Among Women with Children Under 6 years |
| Romanians | 97.7 /100 | #95 | Exceptional 7.2% |
| Immigrants | Eastern Africa | 97.7 /100 | #96 | Exceptional 7.2% |
| Immigrants | South Eastern Asia | 97.6 /100 | #97 | Exceptional 7.2% |
| Russians | 97.5 /100 | #98 | Exceptional 7.2% |
| Immigrants | Europe | 97.5 /100 | #99 | Exceptional 7.2% |
| Immigrants | Northern Europe | 97.4 /100 | #100 | Exceptional 7.2% |
| Chileans | 97.4 /100 | #101 | Exceptional 7.2% |
| Immigrants | Nicaragua | 97.3 /100 | #102 | Exceptional 7.2% |
| Immigrants | Saudi Arabia | 97.3 /100 | #103 | Exceptional 7.2% |
| Immigrants | Egypt | 97.2 /100 | #104 | Exceptional 7.2% |
| Venezuelans | 97.2 /100 | #105 | Exceptional 7.2% |
| Immigrants | Pakistan | 97.2 /100 | #106 | Exceptional 7.2% |
| Immigrants | Kazakhstan | 97.1 /100 | #107 | Exceptional 7.2% |
| Eastern Europeans | 96.9 /100 | #108 | Exceptional 7.2% |
| Australians | 96.9 /100 | #109 | Exceptional 7.2% |
Demographics Similar to Bulgarians by Unemployment Among Women with Children Under 6 years
In terms of unemployment among women with children under 6 years, the demographic groups most similar to Bulgarians are Laotian (6.5%, a difference of 0.15%), Soviet Union (6.5%, a difference of 0.16%), Immigrants from Korea (6.5%, a difference of 0.20%), Cypriot (6.5%, a difference of 0.25%), and Immigrants from Japan (6.5%, a difference of 0.35%).
| Demographics | Rating | Rank | Unemployment Among Women with Children Under 6 years |
| Immigrants | Uzbekistan | 100.0 /100 | #16 | Exceptional 6.3% |
| Immigrants | Malaysia | 100.0 /100 | #17 | Exceptional 6.4% |
| Assyrians/Chaldeans/Syriacs | 100.0 /100 | #18 | Exceptional 6.5% |
| Mongolians | 100.0 /100 | #19 | Exceptional 6.5% |
| Ute | 100.0 /100 | #20 | Exceptional 6.5% |
| Burmese | 100.0 /100 | #21 | Exceptional 6.5% |
| Immigrants | Korea | 100.0 /100 | #22 | Exceptional 6.5% |
| Bulgarians | 100.0 /100 | #23 | Exceptional 6.5% |
| Laotians | 100.0 /100 | #24 | Exceptional 6.5% |
| Soviet Union | 100.0 /100 | #25 | Exceptional 6.5% |
| Cypriots | 100.0 /100 | #26 | Exceptional 6.5% |
| Immigrants | Japan | 100.0 /100 | #27 | Exceptional 6.5% |
| Immigrants | Israel | 100.0 /100 | #28 | Exceptional 6.5% |
| Immigrants | Sweden | 100.0 /100 | #29 | Exceptional 6.6% |
| Immigrants | Belarus | 100.0 /100 | #30 | Exceptional 6.6% |