Immigrants from Netherlands vs Indian (Asian) Unemployment Among Ages 60 to 64 years

COMPARE

Immigrants from Netherlands
Race
Ancestry
AfghanAfricanAlaska NativeAlaskan AthabascanAlbanianAleutAlsatianAmericanApacheArabArapahoArgentineanArmenianAssyrian/Chaldean/SyriacAustralianAustrianBahamianBangladeshiBarbadianBasqueBelgianBelizeanBermudanBhutaneseBlackfeetBolivianBrazilianBritishBritish West IndianBulgarianBurmeseCajunCambodianCanadianCape VerdeanCarpatho RusynCelticCentral AmericanCentral American IndianCherokeeCheyenneChickasawChileanChineseChippewaChoctawColombianColvilleComancheCosta RicanCreeCreekCroatianCrowCubanCypriotCzechCzechoslovakianDanishDelawareDominicanDutchDutch West IndianEastern EuropeanEcuadorianEgyptianEnglishEstonianEthiopianEuropeanFijianFilipinoFinnishFrenchFrench American IndianFrench CanadianGermanGerman RussianGhanaianGreekGuamanian/ChamorroGuatemalanGuyaneseHaitianHmongHonduranHopiHoumaHungarianIcelanderIndonesianInupiatIranianIraqiIrishIroquoisIsraeliItalianJamaicanJapaneseJordanianKenyanKiowaKoreanLaotianLatvianLebaneseLiberianLithuanianLumbeeLuxembourgerMacedonianMalaysianMalteseMarshalleseMenomineeMexicanMexican American IndianMongolianMoroccanNative HawaiianNavajoNepaleseNew ZealanderNicaraguanNigerianNorthern EuropeanNorwegianOkinawanOsageOttawaPaiutePakistaniPalestinianPanamanianParaguayanPennsylvania GermanPeruvianPimaPolishPortuguesePotawatomiPuebloPuerto RicanPuget Sound SalishRomanianRussianSalvadoranSamoanScandinavianScotch-IrishScottishSeminoleSenegaleseSerbianShoshoneSierra LeoneanSiouxSlavicSlovakSloveneSomaliSouth AfricanSouth AmericanSouth American IndianSoviet UnionSpaniardSpanishSpanish AmericanSpanish American IndianSri LankanSubsaharan AfricanSudaneseSwedishSwissSyrianTaiwaneseThaiTlingit-HaidaTohono O'OdhamTonganTrinidadian and TobagonianTsimshianTurkishU.S. Virgin IslanderUgandanUkrainianUruguayanUteVenezuelanVietnameseWelshWest IndianYakamaYaquiYugoslavianYumanYup'ikZimbabwean
Immigration
NonimmigrantsImmigrantsAfghanistanAfricaAlbaniaArgentinaArmeniaAsiaAustraliaAustriaBahamasBangladeshBarbadosBelarusBelgiumBelizeBoliviaBosnia and HerzegovinaBrazilBulgariaBurma/MyanmarCabo VerdeCambodiaCameroonCanadaCaribbeanCentral AmericaChileChinaColombiaCongoCosta RicaCroatiaCubaCzechoslovakiaDenmarkDominicaDominican RepublicEastern AfricaEastern AsiaEastern EuropeEcuadorEgyptEl SalvadorEnglandEritreaEthiopiaEuropeFijiFranceGermanyGhanaGreeceGrenadaGuatemalaGuyanaHaitiHondurasHong KongHungaryIndiaIndonesiaIranIraqIrelandIsraelItalyJamaicaJapanJordanKazakhstanKenyaKoreaKuwaitLaosLatin AmericaLatviaLebanonLiberiaLithuaniaMalaysiaMexicoMicronesiaMiddle AfricaMoldovaMoroccoNepalNetherlandsNicaraguaNigeriaNorth AmericaNorth MacedoniaNorthern AfricaNorthern EuropeNorwayOceaniaPakistanPanamaPeruPhilippinesPolandPortugalRomaniaRussiaSaudi ArabiaScotlandSenegalSerbiaSierra LeoneSingaporeSomaliaSouth AfricaSouth AmericaSouth Central AsiaSouth Eastern AsiaSouthern EuropeSpainSri LankaSt. Vincent and the GrenadinesSudanSwedenSwitzerlandSyriaTaiwanThailandTrinidad and TobagoTurkeyUgandaUkraineUruguayUzbekistanVenezuelaVietnamWest IndiesWestern AfricaWestern AsiaWestern EuropeYemenZaireZimbabweAzores
Indian (Asian)
Race
Ancestry
AfghanAfricanAlaska NativeAlaskan AthabascanAlbanianAleutAlsatianAmericanApacheArabArapahoArgentineanArmenianAssyrian/Chaldean/SyriacAustralianAustrianBahamianBangladeshiBarbadianBasqueBelgianBelizeanBermudanBhutaneseBlackfeetBolivianBrazilianBritishBritish West IndianBulgarianBurmeseCajunCambodianCanadianCape VerdeanCarpatho RusynCelticCentral AmericanCentral American IndianCherokeeCheyenneChickasawChileanChineseChippewaChoctawColombianColvilleComancheCosta RicanCreeCreekCroatianCrowCubanCypriotCzechCzechoslovakianDanishDelawareDominicanDutchDutch West IndianEastern EuropeanEcuadorianEgyptianEnglishEstonianEthiopianEuropeanFijianFilipinoFinnishFrenchFrench American IndianFrench CanadianGermanGerman RussianGhanaianGreekGuamanian/ChamorroGuatemalanGuyaneseHaitianHmongHonduranHopiHoumaHungarianIcelanderIndian (Asian)IndonesianInupiatIranianIraqiIrishIroquoisIsraeliItalianJamaicanJapaneseJordanianKenyanKiowaKoreanLaotianLatvianLebaneseLiberianLithuanianLumbeeLuxembourgerMacedonianMalaysianMalteseMarshalleseMenomineeMexicanMexican American IndianMongolianMoroccanNative HawaiianNavajoNepaleseNew ZealanderNicaraguanNigerianNorthern EuropeanNorwegianOkinawanOsageOttawaPaiutePakistaniPalestinianPanamanianParaguayanPennsylvania GermanPeruvianPimaPolishPortuguesePotawatomiPuebloPuerto RicanPuget Sound SalishRomanianRussianSalvadoranSamoanScandinavianScotch-IrishScottishSeminoleSenegaleseSerbianShoshoneSierra LeoneanSiouxSlavicSlovakSloveneSomaliSouth AfricanSouth AmericanSouth American IndianSoviet UnionSpaniardSpanishSpanish AmericanSpanish American IndianSri LankanSubsaharan AfricanSudaneseSwedishSwissSyrianTaiwaneseThaiTlingit-HaidaTohono O'OdhamTonganTrinidadian and TobagonianTsimshianTurkishU.S. Virgin IslanderUgandanUkrainianUruguayanUteVenezuelanVietnameseWelshWest IndianYakamaYaquiYugoslavianYumanYup'ikZimbabwean
Immigration
NonimmigrantsImmigrantsAfghanistanAfricaAlbaniaArgentinaArmeniaAsiaAustraliaAustriaBahamasBangladeshBarbadosBelarusBelgiumBelizeBoliviaBosnia and HerzegovinaBrazilBulgariaBurma/MyanmarCabo VerdeCambodiaCameroonCanadaCaribbeanCentral AmericaChileChinaColombiaCongoCosta RicaCroatiaCubaCzechoslovakiaDenmarkDominicaDominican RepublicEastern AfricaEastern AsiaEastern EuropeEcuadorEgyptEl SalvadorEnglandEritreaEthiopiaEuropeFijiFranceGermanyGhanaGreeceGrenadaGuatemalaGuyanaHaitiHondurasHong KongHungaryIndiaIndonesiaIranIraqIrelandIsraelItalyJamaicaJapanJordanKazakhstanKenyaKoreaKuwaitLaosLatin AmericaLatviaLebanonLiberiaLithuaniaMalaysiaMexicoMicronesiaMiddle AfricaMoldovaMoroccoNepalNicaraguaNigeriaNorth AmericaNorth MacedoniaNorthern AfricaNorthern EuropeNorwayOceaniaPakistanPanamaPeruPhilippinesPolandPortugalRomaniaRussiaSaudi ArabiaScotlandSenegalSerbiaSierra LeoneSingaporeSomaliaSouth AfricaSouth AmericaSouth Central AsiaSouth Eastern AsiaSouthern EuropeSpainSri LankaSt. Vincent and the GrenadinesSudanSwedenSwitzerlandSyriaTaiwanThailandTrinidad and TobagoTurkeyUgandaUkraineUruguayUzbekistanVenezuelaVietnamWest IndiesWestern AfricaWestern AsiaWestern EuropeYemenZaireZimbabweAzores
Unemployment Among Ages 60 to 64 years
Income
Poverty
Unemployment
Labor Participation
Family Structure
Vehicle Availability
Education Level
Disability

Unemployment Among Ages 60 to 64 years Comparison

Immigrants from Netherlands

Indians (Asian)

Exceptional
Tragic
4.7%
UNEMPLOYMENT AMONG AGES 60 TO 64 YEARS
97.4/ 100
METRIC RATING
109th/ 347
METRIC RANK
5.0%
UNEMPLOYMENT AMONG AGES 60 TO 64 YEARS
2.2/ 100
METRIC RATING
241st/ 347
METRIC RANK

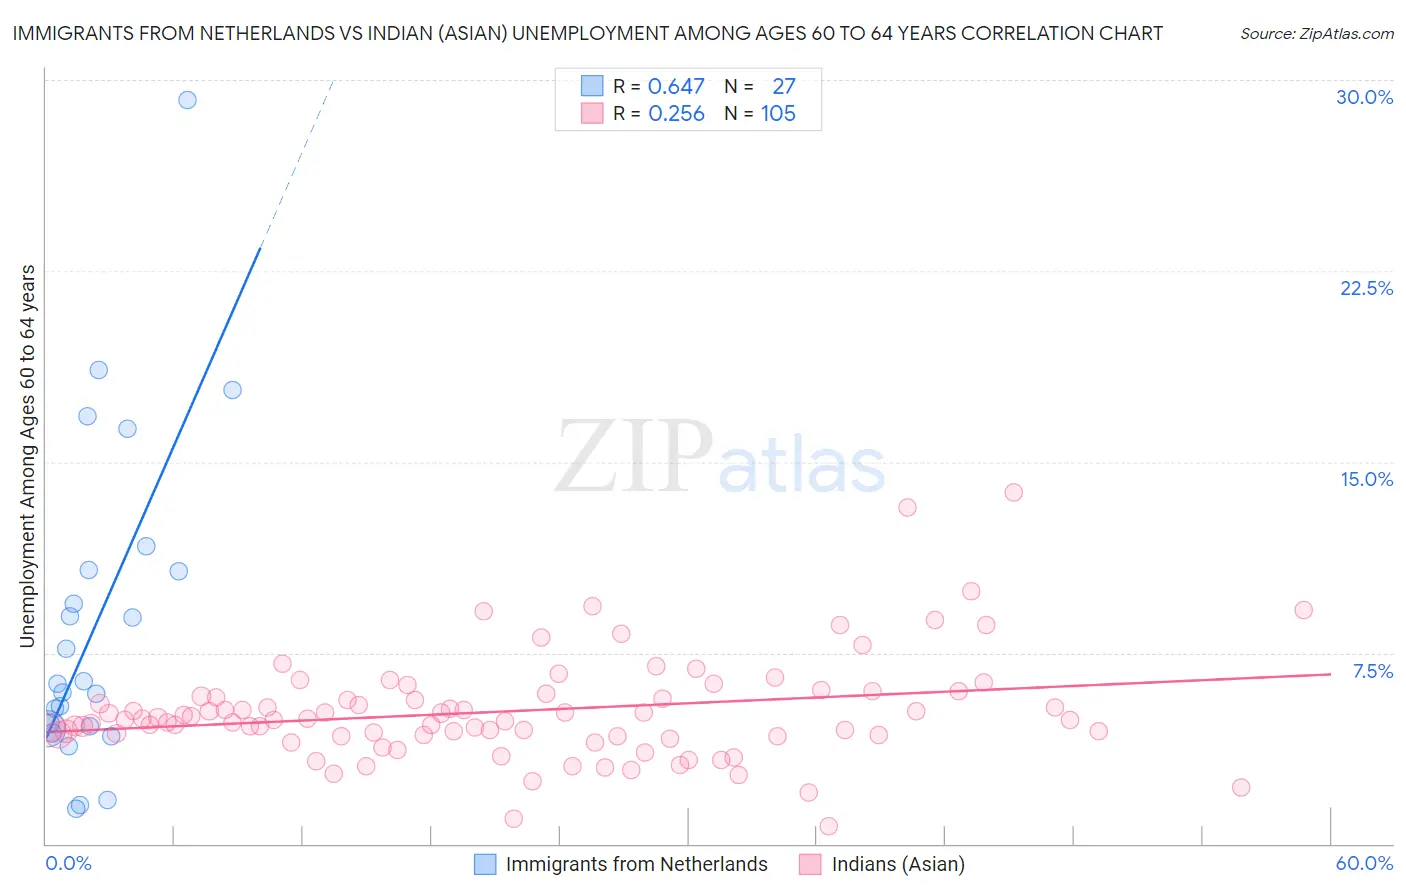
Immigrants from Netherlands vs Indian (Asian) Unemployment Among Ages 60 to 64 years Correlation Chart

The statistical analysis conducted on geographies consisting of 223,908,425 people shows a significant positive correlation between the proportion of Immigrants from Netherlands and unemployment rate among population between the ages 60 and 64 in the United States with a correlation coefficient (R) of 0.647 and weighted average of 4.7%. Similarly, the statistical analysis conducted on geographies consisting of 432,417,886 people shows a weak positive correlation between the proportion of Indians (Asian) and unemployment rate among population between the ages 60 and 64 in the United States with a correlation coefficient (R) of 0.256 and weighted average of 5.0%, a difference of 6.8%.
Immigrants from Netherlands vs Indian (Asian) Unemployment Among Ages 60 to 64 years

Unemployment Among Ages 60 to 64 years Correlation Summary

MeasurementImmigrants from NetherlandsIndian (Asian)
Minimum1.4%0.70%
Maximum29.2%13.8%
Range27.8%13.1%
Mean8.6%5.2%
Median6.3%4.9%
Interquartile 25% (IQ1)4.5%4.3%
Interquartile 75% (IQ3)10.7%5.8%
Interquartile Range (IQR)6.2%1.6%
Standard Deviation (Sample)6.4%2.1%
Standard Deviation (Population)6.3%2.0%

Similar Demographics by Unemployment Among Ages 60 to 64 years

Demographics Similar to Immigrants from Netherlands by Unemployment Among Ages 60 to 64 years

In terms of unemployment among ages 60 to 64 years, the demographic groups most similar to Immigrants from Netherlands are Immigrants from Japan (4.7%, a difference of 0.0%), Greek (4.7%, a difference of 0.040%), Immigrants from North America (4.7%, a difference of 0.060%), Ethiopian (4.7%, a difference of 0.070%), and Canadian (4.7%, a difference of 0.090%).
DemographicsRating | RankUnemployment Among Ages 60 to 64 years
Immigrants | Canada
97.8
/100
|
#102
Exceptional
4.7%
Whites/Caucasians
97.8
/100
|
#103
Exceptional
4.7%
Paraguayans
97.7
/100
|
#104
Exceptional
4.7%
Canadians
97.7
/100
|
#105
Exceptional
4.7%
Immigrants | North America
97.6
/100
|
#106
Exceptional
4.7%
Greeks
97.5
/100
|
#107
Exceptional
4.7%
Immigrants | Japan
97.4
/100
|
#108
Exceptional
4.7%
Immigrants | Netherlands
97.4
/100
|
#109
Exceptional
4.7%
Ethiopians
97.2
/100
|
#110
Exceptional
4.7%
French
97.1
/100
|
#111
Exceptional
4.7%
Syrians
97.0
/100
|
#112
Exceptional
4.7%
Bulgarians
96.6
/100
|
#113
Exceptional
4.7%
Maltese
96.5
/100
|
#114
Exceptional
4.7%
Immigrants | Romania
96.4
/100
|
#115
Exceptional
4.7%
Immigrants | England
96.3
/100
|
#116
Exceptional
4.7%

Demographics Similar to Indians (Asian) by Unemployment Among Ages 60 to 64 years

In terms of unemployment among ages 60 to 64 years, the demographic groups most similar to Indians (Asian) are Immigrants from Croatia (5.0%, a difference of 0.010%), Argentinean (5.0%, a difference of 0.050%), Ghanaian (5.0%, a difference of 0.080%), Immigrants from Philippines (5.0%, a difference of 0.15%), and Immigrants from Western Asia (5.0%, a difference of 0.26%).
DemographicsRating | RankUnemployment Among Ages 60 to 64 years
Iranians
4.2
/100
|
#234
Tragic
5.0%
Delaware
3.6
/100
|
#235
Tragic
5.0%
Immigrants | Sierra Leone
3.1
/100
|
#236
Tragic
5.0%
Immigrants | Western Asia
3.0
/100
|
#237
Tragic
5.0%
Immigrants | Poland
3.0
/100
|
#238
Tragic
5.0%
Ghanaians
2.4
/100
|
#239
Tragic
5.0%
Immigrants | Croatia
2.2
/100
|
#240
Tragic
5.0%
Indians (Asian)
2.2
/100
|
#241
Tragic
5.0%
Argentineans
2.1
/100
|
#242
Tragic
5.0%
Immigrants | Philippines
1.9
/100
|
#243
Tragic
5.0%
Peruvians
1.6
/100
|
#244
Tragic
5.0%
Comanche
1.3
/100
|
#245
Tragic
5.0%
Immigrants | South America
1.1
/100
|
#246
Tragic
5.0%
Immigrants | North Macedonia
1.1
/100
|
#247
Tragic
5.0%
Immigrants | Fiji
1.1
/100
|
#248
Tragic
5.1%