Immigrants from Netherlands vs Bhutanese Unemployment Among Seniors over 75 years
COMPARE
Immigrants from Netherlands
Bhutanese
Unemployment Among Seniors over 75 years
Unemployment Among Seniors over 75 years Comparison
Immigrants from Netherlands
Bhutanese
8.1%
UNEMPLOYMENT AMONG SENIORS OVER 75 YEARS
99.5/ 100
METRIC RATING
93rd/ 347
METRIC RANK
8.0%
UNEMPLOYMENT AMONG SENIORS OVER 75 YEARS
99.7/ 100
METRIC RATING
82nd/ 347
METRIC RANK
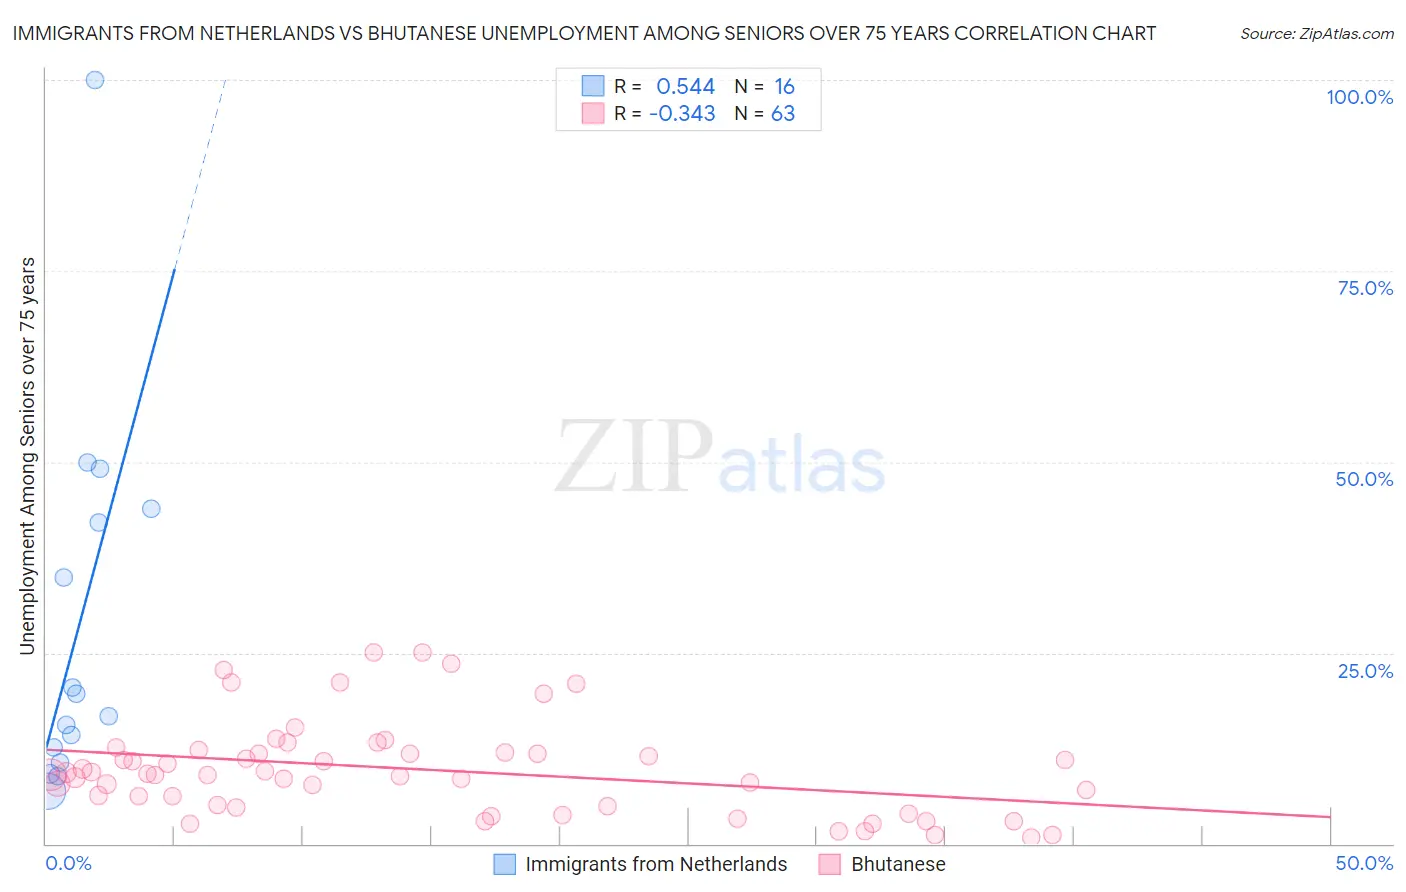
Immigrants from Netherlands vs Bhutanese Unemployment Among Seniors over 75 years Correlation Chart
The statistical analysis conducted on geographies consisting of 147,093,510 people shows a substantial positive correlation between the proportion of Immigrants from Netherlands and unemployment rate among seniors over the age of 75 in the United States with a correlation coefficient (R) of 0.544 and weighted average of 8.1%. Similarly, the statistical analysis conducted on geographies consisting of 217,028,155 people shows a mild negative correlation between the proportion of Bhutanese and unemployment rate among seniors over the age of 75 in the United States with a correlation coefficient (R) of -0.343 and weighted average of 8.0%, a difference of 1.1%.
Unemployment Among Seniors over 75 years Correlation Summary
| Measurement | Immigrants from Netherlands | Bhutanese |
| Minimum | 6.8% | 0.80% |
| Maximum | 100.0% | 25.0% |
| Range | 93.2% | 24.2% |
| Mean | 28.4% | 9.7% |
| Median | 18.2% | 9.1% |
| Interquartile 25% (IQ1) | 11.7% | 4.9% |
| Interquartile 75% (IQ3) | 43.0% | 11.9% |
| Interquartile Range (IQR) | 31.3% | 7.0% |
| Standard Deviation (Sample) | 24.4% | 6.1% |
| Standard Deviation (Population) | 23.6% | 6.1% |
Demographics Similar to Immigrants from Netherlands and Bhutanese by Unemployment Among Seniors over 75 years
In terms of unemployment among seniors over 75 years, the demographic groups most similar to Immigrants from Netherlands are Immigrants from Ireland (8.1%, a difference of 0.030%), Venezuelan (8.1%, a difference of 0.080%), Egyptian (8.1%, a difference of 0.090%), Immigrants from Vietnam (8.1%, a difference of 0.13%), and Immigrants from Korea (8.1%, a difference of 0.21%). Similarly, the demographic groups most similar to Bhutanese are Cuban (8.0%, a difference of 0.020%), Immigrants from Australia (8.0%, a difference of 0.030%), Immigrants from Japan (8.0%, a difference of 0.040%), Arapaho (8.1%, a difference of 0.11%), and U.S. Virgin Islander (8.1%, a difference of 0.19%).
| Demographics | Rating | Rank | Unemployment Among Seniors over 75 years |
| Immigrants | Turkey | 99.8 /100 | #77 | Exceptional 8.0% |
| Immigrants | Belarus | 99.8 /100 | #78 | Exceptional 8.0% |
| Immigrants | Japan | 99.7 /100 | #79 | Exceptional 8.0% |
| Immigrants | Australia | 99.7 /100 | #80 | Exceptional 8.0% |
| Cubans | 99.7 /100 | #81 | Exceptional 8.0% |
| Bhutanese | 99.7 /100 | #82 | Exceptional 8.0% |
| Arapaho | 99.7 /100 | #83 | Exceptional 8.1% |
| U.S. Virgin Islanders | 99.7 /100 | #84 | Exceptional 8.1% |
| Immigrants | Indonesia | 99.7 /100 | #85 | Exceptional 8.1% |
| Immigrants | Singapore | 99.7 /100 | #86 | Exceptional 8.1% |
| Basques | 99.5 /100 | #87 | Exceptional 8.1% |
| New Zealanders | 99.5 /100 | #88 | Exceptional 8.1% |
| Immigrants | Korea | 99.5 /100 | #89 | Exceptional 8.1% |
| Immigrants | Vietnam | 99.5 /100 | #90 | Exceptional 8.1% |
| Egyptians | 99.5 /100 | #91 | Exceptional 8.1% |
| Venezuelans | 99.5 /100 | #92 | Exceptional 8.1% |
| Immigrants | Netherlands | 99.5 /100 | #93 | Exceptional 8.1% |
| Immigrants | Ireland | 99.4 /100 | #94 | Exceptional 8.1% |
| Nicaraguans | 99.3 /100 | #95 | Exceptional 8.2% |
| Immigrants | Belgium | 99.3 /100 | #96 | Exceptional 8.2% |
| Immigrants | Sri Lanka | 99.3 /100 | #97 | Exceptional 8.2% |