Immigrants from Nepal vs Immigrants from Taiwan Unemployment Among Seniors over 75 years
COMPARE
Immigrants from Nepal
Immigrants from Taiwan
Unemployment Among Seniors over 75 years
Unemployment Among Seniors over 75 years Comparison
Immigrants from Nepal
Immigrants from Taiwan
8.3%
UNEMPLOYMENT AMONG SENIORS OVER 75 YEARS
96.9/ 100
METRIC RATING
123rd/ 347
METRIC RANK
7.9%
UNEMPLOYMENT AMONG SENIORS OVER 75 YEARS
99.9/ 100
METRIC RATING
64th/ 347
METRIC RANK
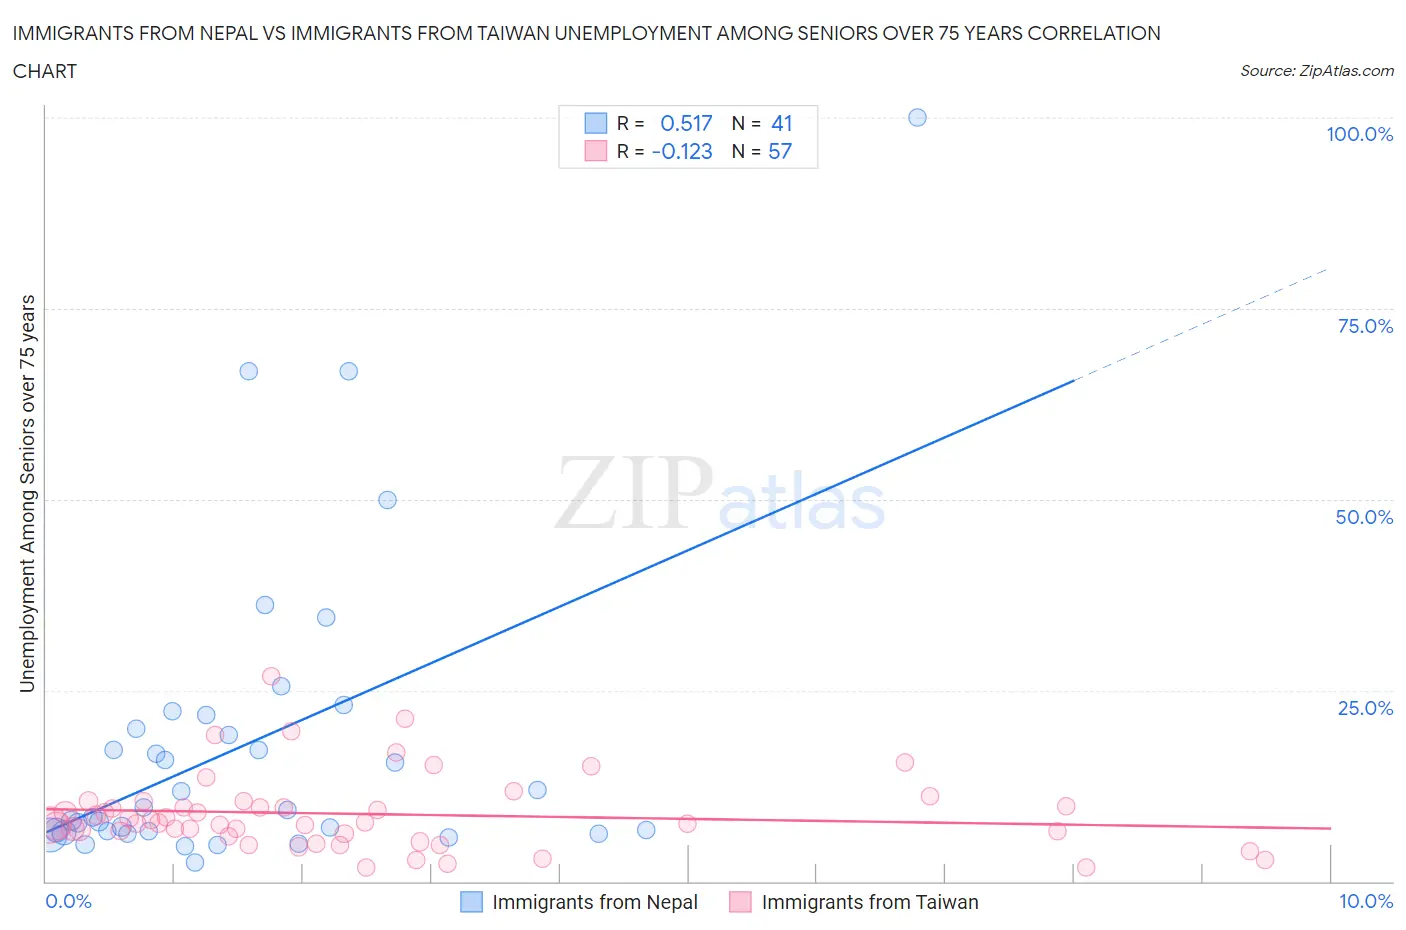
Immigrants from Nepal vs Immigrants from Taiwan Unemployment Among Seniors over 75 years Correlation Chart
The statistical analysis conducted on geographies consisting of 118,449,831 people shows a substantial positive correlation between the proportion of Immigrants from Nepal and unemployment rate among seniors over the age of 75 in the United States with a correlation coefficient (R) of 0.517 and weighted average of 8.3%. Similarly, the statistical analysis conducted on geographies consisting of 171,248,279 people shows a poor negative correlation between the proportion of Immigrants from Taiwan and unemployment rate among seniors over the age of 75 in the United States with a correlation coefficient (R) of -0.123 and weighted average of 7.9%, a difference of 5.1%.
Unemployment Among Seniors over 75 years Correlation Summary
| Measurement | Immigrants from Nepal | Immigrants from Taiwan |
| Minimum | 2.4% | 1.8% |
| Maximum | 100.0% | 26.8% |
| Range | 97.6% | 25.0% |
| Mean | 18.0% | 8.8% |
| Median | 9.3% | 7.6% |
| Interquartile 25% (IQ1) | 6.5% | 6.1% |
| Interquartile 75% (IQ3) | 20.9% | 10.1% |
| Interquartile Range (IQR) | 14.4% | 4.0% |
| Standard Deviation (Sample) | 20.2% | 4.9% |
| Standard Deviation (Population) | 19.9% | 4.9% |
Similar Demographics by Unemployment Among Seniors over 75 years
Demographics Similar to Immigrants from Nepal by Unemployment Among Seniors over 75 years
In terms of unemployment among seniors over 75 years, the demographic groups most similar to Immigrants from Nepal are Thai (8.3%, a difference of 0.040%), Immigrants from Moldova (8.3%, a difference of 0.060%), Immigrants from Russia (8.3%, a difference of 0.080%), Immigrants from Croatia (8.3%, a difference of 0.15%), and Immigrants from Asia (8.3%, a difference of 0.27%).
| Demographics | Rating | Rank | Unemployment Among Seniors over 75 years |
| Immigrants | West Indies | 98.1 /100 | #116 | Exceptional 8.3% |
| Immigrants | Greece | 97.9 /100 | #117 | Exceptional 8.3% |
| Immigrants | Middle Africa | 97.9 /100 | #118 | Exceptional 8.3% |
| Japanese | 97.5 /100 | #119 | Exceptional 8.3% |
| Immigrants | Asia | 97.4 /100 | #120 | Exceptional 8.3% |
| Immigrants | Croatia | 97.2 /100 | #121 | Exceptional 8.3% |
| Immigrants | Russia | 97.1 /100 | #122 | Exceptional 8.3% |
| Immigrants | Nepal | 96.9 /100 | #123 | Exceptional 8.3% |
| Thais | 96.8 /100 | #124 | Exceptional 8.3% |
| Immigrants | Moldova | 96.7 /100 | #125 | Exceptional 8.3% |
| Belizeans | 96.3 /100 | #126 | Exceptional 8.4% |
| Hondurans | 96.2 /100 | #127 | Exceptional 8.4% |
| Native Hawaiians | 96.1 /100 | #128 | Exceptional 8.4% |
| Ghanaians | 96.0 /100 | #129 | Exceptional 8.4% |
| Apache | 95.2 /100 | #130 | Exceptional 8.4% |
Demographics Similar to Immigrants from Taiwan by Unemployment Among Seniors over 75 years
In terms of unemployment among seniors over 75 years, the demographic groups most similar to Immigrants from Taiwan are Immigrants from Nicaragua (7.9%, a difference of 0.060%), Argentinean (7.9%, a difference of 0.060%), Immigrants from Albania (7.9%, a difference of 0.13%), Uruguayan (7.9%, a difference of 0.16%), and Immigrants from Morocco (7.9%, a difference of 0.20%).
| Demographics | Rating | Rank | Unemployment Among Seniors over 75 years |
| Ottawa | 99.9 /100 | #57 | Exceptional 7.9% |
| Iranians | 99.9 /100 | #58 | Exceptional 7.9% |
| Indonesians | 99.9 /100 | #59 | Exceptional 7.9% |
| Immigrants | Morocco | 99.9 /100 | #60 | Exceptional 7.9% |
| Uruguayans | 99.9 /100 | #61 | Exceptional 7.9% |
| Immigrants | Albania | 99.9 /100 | #62 | Exceptional 7.9% |
| Immigrants | Nicaragua | 99.9 /100 | #63 | Exceptional 7.9% |
| Immigrants | Taiwan | 99.9 /100 | #64 | Exceptional 7.9% |
| Argentineans | 99.9 /100 | #65 | Exceptional 7.9% |
| Immigrants | Austria | 99.9 /100 | #66 | Exceptional 8.0% |
| Immigrants | Syria | 99.9 /100 | #67 | Exceptional 8.0% |
| Immigrants | South Africa | 99.9 /100 | #68 | Exceptional 8.0% |
| Indians (Asian) | 99.9 /100 | #69 | Exceptional 8.0% |
| Immigrants | Argentina | 99.9 /100 | #70 | Exceptional 8.0% |
| Immigrants | Cambodia | 99.9 /100 | #71 | Exceptional 8.0% |