Immigrants from Morocco vs Immigrants from Sudan Unemployment Among Women with Children Under 18 years
COMPARE
Immigrants from Morocco
Immigrants from Sudan
Unemployment Among Women with Children Under 18 years
Unemployment Among Women with Children Under 18 years Comparison
Immigrants from Morocco
Immigrants from Sudan
5.6%
UNEMPLOYMENT AMONG WOMEN WITH CHILDREN UNDER 18 YEARS
17.9/ 100
METRIC RATING
201st/ 347
METRIC RANK
5.5%
UNEMPLOYMENT AMONG WOMEN WITH CHILDREN UNDER 18 YEARS
40.6/ 100
METRIC RATING
182nd/ 347
METRIC RANK
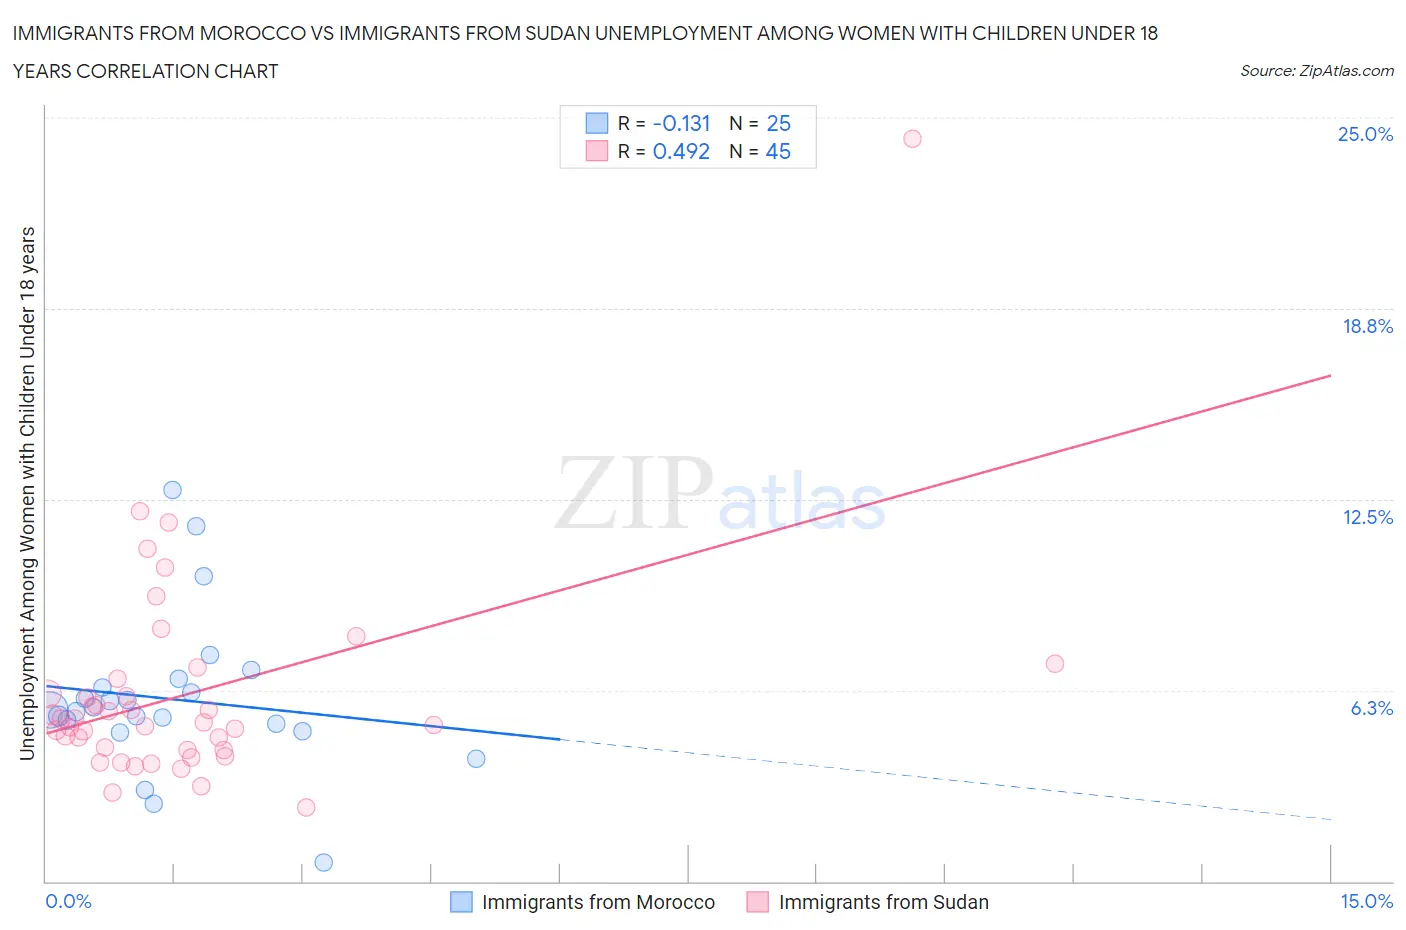
Immigrants from Morocco vs Immigrants from Sudan Unemployment Among Women with Children Under 18 years Correlation Chart
The statistical analysis conducted on geographies consisting of 176,971,185 people shows a poor negative correlation between the proportion of Immigrants from Morocco and unemployment rate among women with children under the age of 18 in the United States with a correlation coefficient (R) of -0.131 and weighted average of 5.6%. Similarly, the statistical analysis conducted on geographies consisting of 117,921,145 people shows a moderate positive correlation between the proportion of Immigrants from Sudan and unemployment rate among women with children under the age of 18 in the United States with a correlation coefficient (R) of 0.492 and weighted average of 5.5%, a difference of 2.0%.
Unemployment Among Women with Children Under 18 years Correlation Summary
| Measurement | Immigrants from Morocco | Immigrants from Sudan |
| Minimum | 0.60% | 2.4% |
| Maximum | 12.8% | 24.3% |
| Range | 12.2% | 21.9% |
| Mean | 6.0% | 6.1% |
| Median | 5.6% | 5.2% |
| Interquartile 25% (IQ1) | 5.0% | 4.3% |
| Interquartile 75% (IQ3) | 6.5% | 6.4% |
| Interquartile Range (IQR) | 1.5% | 2.1% |
| Standard Deviation (Sample) | 2.6% | 3.5% |
| Standard Deviation (Population) | 2.5% | 3.5% |
Demographics Similar to Immigrants from Morocco and Immigrants from Sudan by Unemployment Among Women with Children Under 18 years
In terms of unemployment among women with children under 18 years, the demographic groups most similar to Immigrants from Morocco are Menominee (5.6%, a difference of 0.080%), Marshallese (5.6%, a difference of 0.26%), Immigrants from Colombia (5.6%, a difference of 0.39%), Arab (5.6%, a difference of 0.39%), and Spaniard (5.6%, a difference of 0.53%). Similarly, the demographic groups most similar to Immigrants from Sudan are Immigrants from Hungary (5.5%, a difference of 0.060%), Immigrants from Laos (5.5%, a difference of 0.13%), Immigrants from Cambodia (5.5%, a difference of 0.16%), Immigrants from Zaire (5.5%, a difference of 0.19%), and Indonesian (5.5%, a difference of 0.32%).
| Demographics | Rating | Rank | Unemployment Among Women with Children Under 18 years |
| Immigrants | Hungary | 41.3 /100 | #181 | Average 5.5% |
| Immigrants | Sudan | 40.6 /100 | #182 | Average 5.5% |
| Immigrants | Laos | 38.8 /100 | #183 | Fair 5.5% |
| Immigrants | Cambodia | 38.4 /100 | #184 | Fair 5.5% |
| Immigrants | Zaire | 38.1 /100 | #185 | Fair 5.5% |
| Indonesians | 36.3 /100 | #186 | Fair 5.5% |
| Malaysians | 35.7 /100 | #187 | Fair 5.5% |
| Iraqis | 35.3 /100 | #188 | Fair 5.5% |
| Immigrants | Eritrea | 33.8 /100 | #189 | Fair 5.5% |
| Immigrants | Poland | 31.2 /100 | #190 | Fair 5.5% |
| South American Indians | 30.8 /100 | #191 | Fair 5.5% |
| Immigrants | Spain | 30.7 /100 | #192 | Fair 5.5% |
| Immigrants | Afghanistan | 29.3 /100 | #193 | Fair 5.5% |
| Immigrants | Chile | 29.2 /100 | #194 | Fair 5.5% |
| Colombians | 22.8 /100 | #195 | Fair 5.6% |
| Spaniards | 22.8 /100 | #196 | Fair 5.6% |
| Immigrants | Colombia | 21.4 /100 | #197 | Fair 5.6% |
| Arabs | 21.4 /100 | #198 | Fair 5.6% |
| Marshallese | 20.2 /100 | #199 | Fair 5.6% |
| Menominee | 18.6 /100 | #200 | Poor 5.6% |
| Immigrants | Morocco | 17.9 /100 | #201 | Poor 5.6% |