Immigrants from Morocco vs Immigrants from Poland Male Unemployment
COMPARE
Immigrants from Morocco
Immigrants from Poland
Male Unemployment
Male Unemployment Comparison
Immigrants from Morocco
Immigrants from Poland
5.3%
MALE UNEMPLOYMENT
60.2/ 100
METRIC RATING
166th/ 347
METRIC RANK
5.3%
MALE UNEMPLOYMENT
46.0/ 100
METRIC RATING
176th/ 347
METRIC RANK
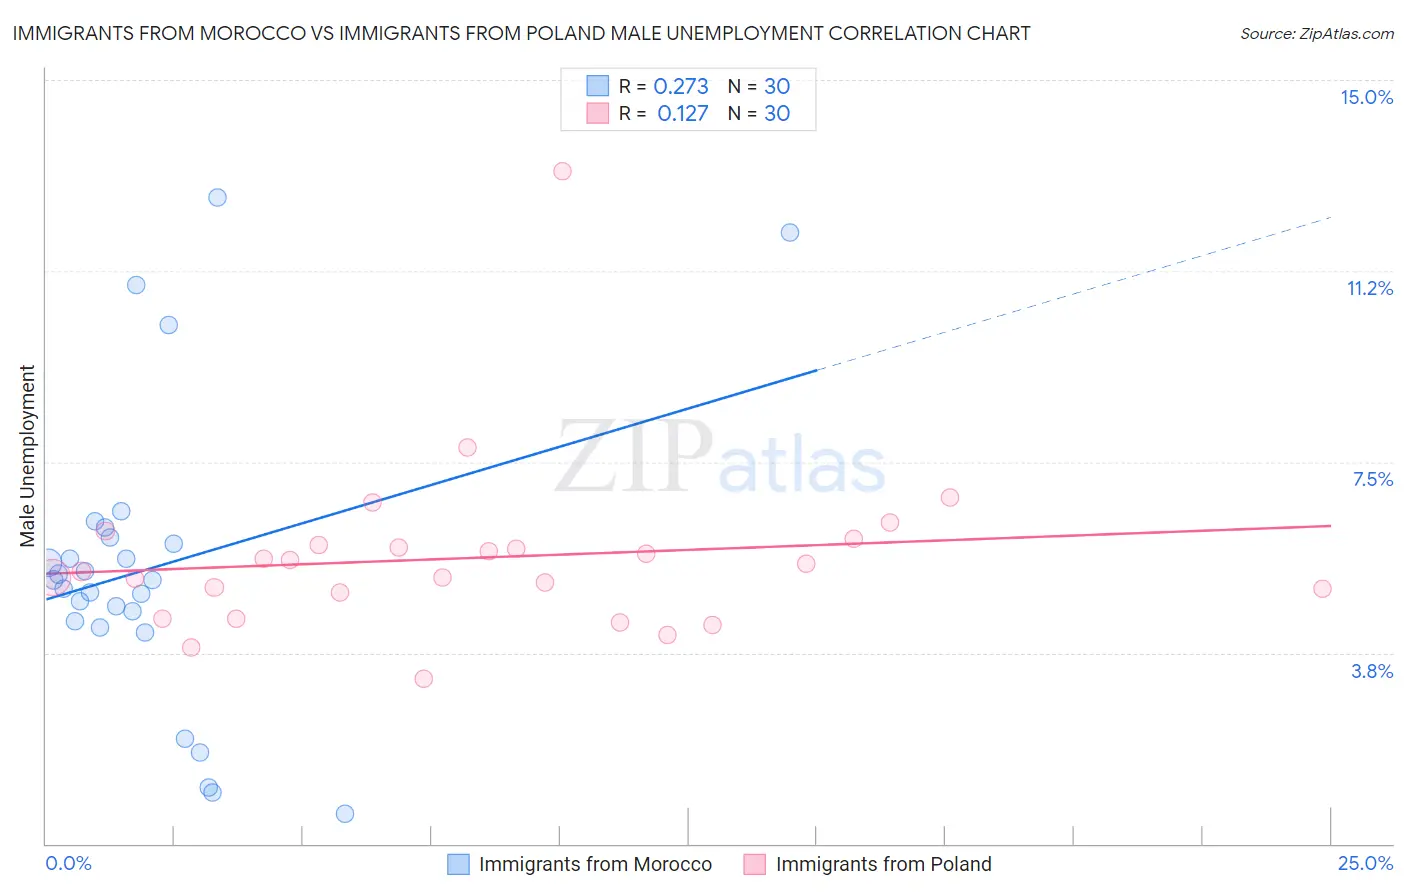
Immigrants from Morocco vs Immigrants from Poland Male Unemployment Correlation Chart
The statistical analysis conducted on geographies consisting of 178,783,560 people shows a weak positive correlation between the proportion of Immigrants from Morocco and unemployment rate among males in the United States with a correlation coefficient (R) of 0.273 and weighted average of 5.3%. Similarly, the statistical analysis conducted on geographies consisting of 304,027,535 people shows a poor positive correlation between the proportion of Immigrants from Poland and unemployment rate among males in the United States with a correlation coefficient (R) of 0.127 and weighted average of 5.3%, a difference of 0.84%.
Male Unemployment Correlation Summary
| Measurement | Immigrants from Morocco | Immigrants from Poland |
| Minimum | 0.60% | 3.3% |
| Maximum | 12.7% | 13.2% |
| Range | 12.1% | 9.9% |
| Mean | 5.4% | 5.6% |
| Median | 5.2% | 5.4% |
| Interquartile 25% (IQ1) | 4.4% | 4.9% |
| Interquartile 75% (IQ3) | 6.0% | 5.9% |
| Interquartile Range (IQR) | 1.6% | 0.93% |
| Standard Deviation (Sample) | 2.9% | 1.7% |
| Standard Deviation (Population) | 2.9% | 1.7% |
Demographics Similar to Immigrants from Morocco and Immigrants from Poland by Male Unemployment
In terms of male unemployment, the demographic groups most similar to Immigrants from Morocco are South American (5.3%, a difference of 0.030%), Afghan (5.3%, a difference of 0.11%), Immigrants from Vietnam (5.3%, a difference of 0.12%), Immigrants from Ireland (5.3%, a difference of 0.15%), and Immigrants from Congo (5.3%, a difference of 0.17%). Similarly, the demographic groups most similar to Immigrants from Poland are Immigrants from Peru (5.3%, a difference of 0.080%), Immigrants from Iraq (5.3%, a difference of 0.12%), Osage (5.3%, a difference of 0.21%), Immigrants from Iran (5.3%, a difference of 0.23%), and Immigrants from Kazakhstan (5.3%, a difference of 0.28%).
| Demographics | Rating | Rank | Male Unemployment |
| Immigrants | China | 70.6 /100 | #161 | Good 5.2% |
| Immigrants | Egypt | 65.9 /100 | #162 | Good 5.2% |
| Immigrants | Hong Kong | 65.7 /100 | #163 | Good 5.2% |
| Afghans | 62.0 /100 | #164 | Good 5.3% |
| South Americans | 60.6 /100 | #165 | Good 5.3% |
| Immigrants | Morocco | 60.2 /100 | #166 | Good 5.3% |
| Immigrants | Vietnam | 58.1 /100 | #167 | Average 5.3% |
| Immigrants | Ireland | 57.7 /100 | #168 | Average 5.3% |
| Immigrants | Congo | 57.4 /100 | #169 | Average 5.3% |
| Immigrants | Eastern Europe | 54.1 /100 | #170 | Average 5.3% |
| Peruvians | 51.9 /100 | #171 | Average 5.3% |
| Immigrants | Kazakhstan | 50.8 /100 | #172 | Average 5.3% |
| Immigrants | Russia | 50.7 /100 | #173 | Average 5.3% |
| Immigrants | Iran | 50.0 /100 | #174 | Average 5.3% |
| Immigrants | Iraq | 48.1 /100 | #175 | Average 5.3% |
| Immigrants | Poland | 46.0 /100 | #176 | Average 5.3% |
| Immigrants | Peru | 44.6 /100 | #177 | Average 5.3% |
| Osage | 42.5 /100 | #178 | Average 5.3% |
| Immigrants | Oceania | 40.8 /100 | #179 | Average 5.3% |
| Malaysians | 39.6 /100 | #180 | Fair 5.3% |
| Immigrants | Afghanistan | 37.9 /100 | #181 | Fair 5.3% |