Immigrants from Morocco vs Immigrants from Cambodia Unemployment Among Ages 20 to 24 years
COMPARE
Immigrants from Morocco
Immigrants from Cambodia
Unemployment Among Ages 20 to 24 years
Unemployment Among Ages 20 to 24 years Comparison
Immigrants from Morocco
Immigrants from Cambodia
10.1%
UNEMPLOYMENT AMONG AGES 20 TO 24 YEARS
90.5/ 100
METRIC RATING
115th/ 347
METRIC RANK
9.8%
UNEMPLOYMENT AMONG AGES 20 TO 24 YEARS
99.6/ 100
METRIC RATING
54th/ 347
METRIC RANK
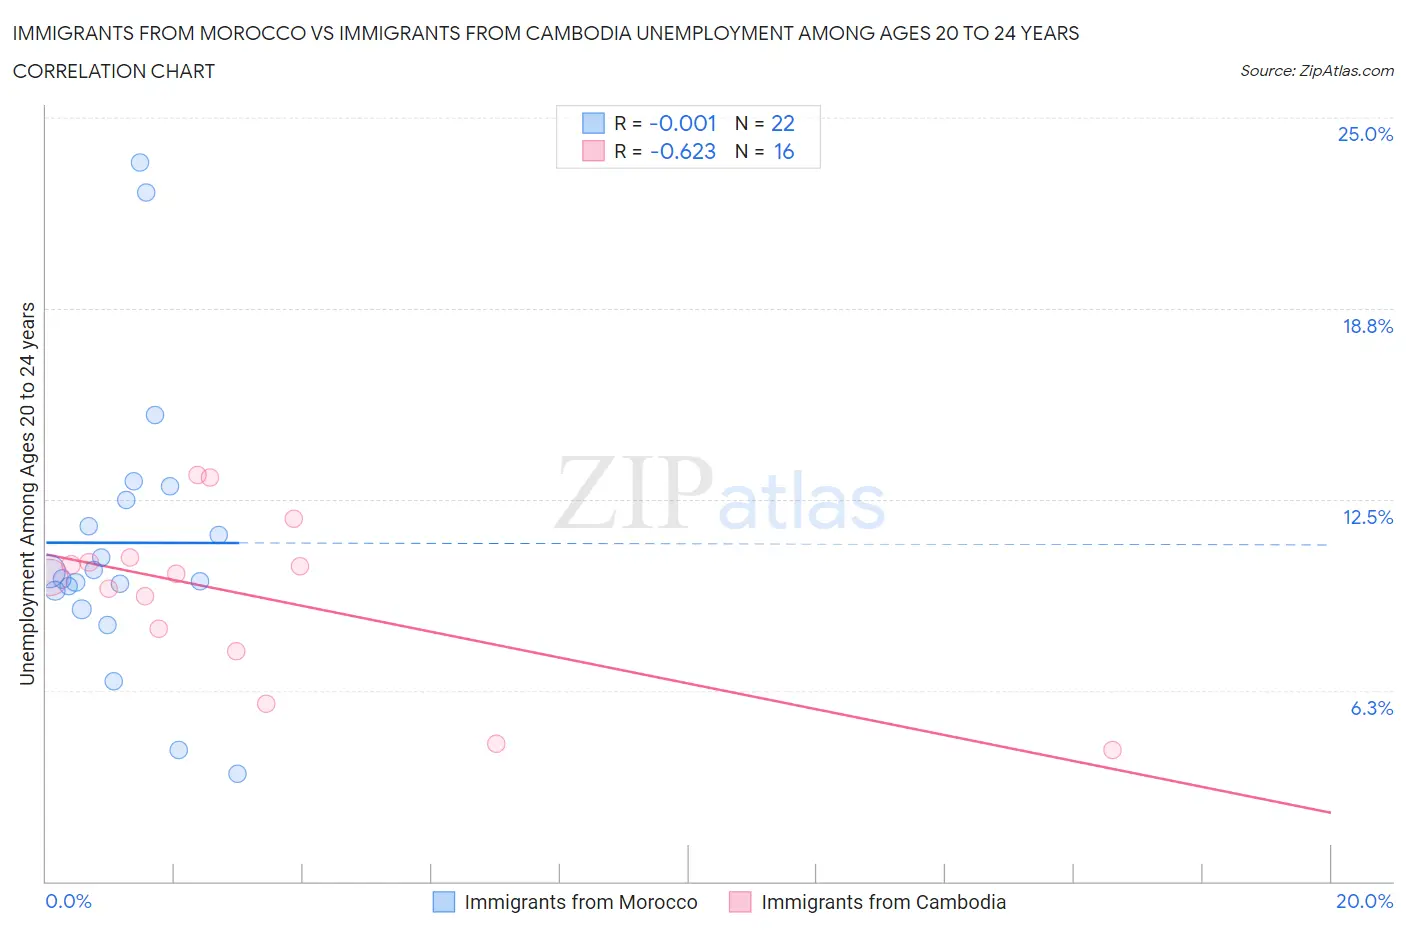
Immigrants from Morocco vs Immigrants from Cambodia Unemployment Among Ages 20 to 24 years Correlation Chart
The statistical analysis conducted on geographies consisting of 177,201,204 people shows no correlation between the proportion of Immigrants from Morocco and unemployment rate among population between the ages 20 and 24 in the United States with a correlation coefficient (R) of -0.001 and weighted average of 10.1%. Similarly, the statistical analysis conducted on geographies consisting of 203,026,803 people shows a significant negative correlation between the proportion of Immigrants from Cambodia and unemployment rate among population between the ages 20 and 24 in the United States with a correlation coefficient (R) of -0.623 and weighted average of 9.8%, a difference of 3.2%.
Unemployment Among Ages 20 to 24 years Correlation Summary
| Measurement | Immigrants from Morocco | Immigrants from Cambodia |
| Minimum | 3.5% | 4.3% |
| Maximum | 23.5% | 13.3% |
| Range | 20.0% | 9.0% |
| Mean | 11.1% | 9.3% |
| Median | 10.0% | 10.0% |
| Interquartile 25% (IQ1) | 9.5% | 7.9% |
| Interquartile 75% (IQ3) | 12.5% | 10.5% |
| Interquartile Range (IQR) | 3.0% | 2.6% |
| Standard Deviation (Sample) | 4.7% | 2.7% |
| Standard Deviation (Population) | 4.6% | 2.6% |
Similar Demographics by Unemployment Among Ages 20 to 24 years
Demographics Similar to Immigrants from Morocco by Unemployment Among Ages 20 to 24 years
In terms of unemployment among ages 20 to 24 years, the demographic groups most similar to Immigrants from Morocco are Ottawa (10.1%, a difference of 0.040%), Basque (10.1%, a difference of 0.070%), Immigrants from Uruguay (10.1%, a difference of 0.090%), Paraguayan (10.1%, a difference of 0.19%), and French (10.1%, a difference of 0.22%).
| Demographics | Rating | Rank | Unemployment Among Ages 20 to 24 years |
| Immigrants | Latvia | 93.2 /100 | #108 | Exceptional 10.1% |
| Filipinos | 93.2 /100 | #109 | Exceptional 10.1% |
| Immigrants | Spain | 93.1 /100 | #110 | Exceptional 10.1% |
| Immigrants | Indonesia | 92.7 /100 | #111 | Exceptional 10.1% |
| Northern Europeans | 92.7 /100 | #112 | Exceptional 10.1% |
| German Russians | 92.4 /100 | #113 | Exceptional 10.1% |
| Ottawa | 90.8 /100 | #114 | Exceptional 10.1% |
| Immigrants | Morocco | 90.5 /100 | #115 | Exceptional 10.1% |
| Basques | 89.8 /100 | #116 | Excellent 10.1% |
| Immigrants | Uruguay | 89.6 /100 | #117 | Excellent 10.1% |
| Paraguayans | 88.6 /100 | #118 | Excellent 10.1% |
| French | 88.2 /100 | #119 | Excellent 10.1% |
| Immigrants | Canada | 88.2 /100 | #120 | Excellent 10.1% |
| South Africans | 87.8 /100 | #121 | Excellent 10.1% |
| Whites/Caucasians | 87.4 /100 | #122 | Excellent 10.1% |
Demographics Similar to Immigrants from Cambodia by Unemployment Among Ages 20 to 24 years
In terms of unemployment among ages 20 to 24 years, the demographic groups most similar to Immigrants from Cambodia are Immigrants from Serbia (9.8%, a difference of 0.040%), Carpatho Rusyn (9.8%, a difference of 0.13%), Nicaraguan (9.8%, a difference of 0.14%), Immigrants from Thailand (9.8%, a difference of 0.15%), and Ethiopian (9.8%, a difference of 0.26%).
| Demographics | Rating | Rank | Unemployment Among Ages 20 to 24 years |
| Immigrants | India | 99.8 /100 | #47 | Exceptional 9.7% |
| Finns | 99.8 /100 | #48 | Exceptional 9.7% |
| Creek | 99.8 /100 | #49 | Exceptional 9.7% |
| Immigrants | Kenya | 99.7 /100 | #50 | Exceptional 9.7% |
| Ethiopians | 99.7 /100 | #51 | Exceptional 9.8% |
| Immigrants | Thailand | 99.7 /100 | #52 | Exceptional 9.8% |
| Immigrants | Serbia | 99.6 /100 | #53 | Exceptional 9.8% |
| Immigrants | Cambodia | 99.6 /100 | #54 | Exceptional 9.8% |
| Carpatho Rusyns | 99.6 /100 | #55 | Exceptional 9.8% |
| Nicaraguans | 99.6 /100 | #56 | Exceptional 9.8% |
| Immigrants | Moldova | 99.5 /100 | #57 | Exceptional 9.8% |
| Pakistanis | 99.5 /100 | #58 | Exceptional 9.8% |
| English | 99.5 /100 | #59 | Exceptional 9.8% |
| Immigrants | Kuwait | 99.5 /100 | #60 | Exceptional 9.8% |
| Malaysians | 99.5 /100 | #61 | Exceptional 9.8% |