Immigrants from Moldova vs Basque Unemployment Among Ages 16 to 19 years
COMPARE
Immigrants from Moldova
Basque
Unemployment Among Ages 16 to 19 years
Unemployment Among Ages 16 to 19 years Comparison
Immigrants from Moldova
Basques
17.1%
UNEMPLOYMENT AMONG AGES 16 TO 19 YEARS
90.7/ 100
METRIC RATING
121st/ 347
METRIC RANK
17.3%
UNEMPLOYMENT AMONG AGES 16 TO 19 YEARS
80.7/ 100
METRIC RATING
141st/ 347
METRIC RANK
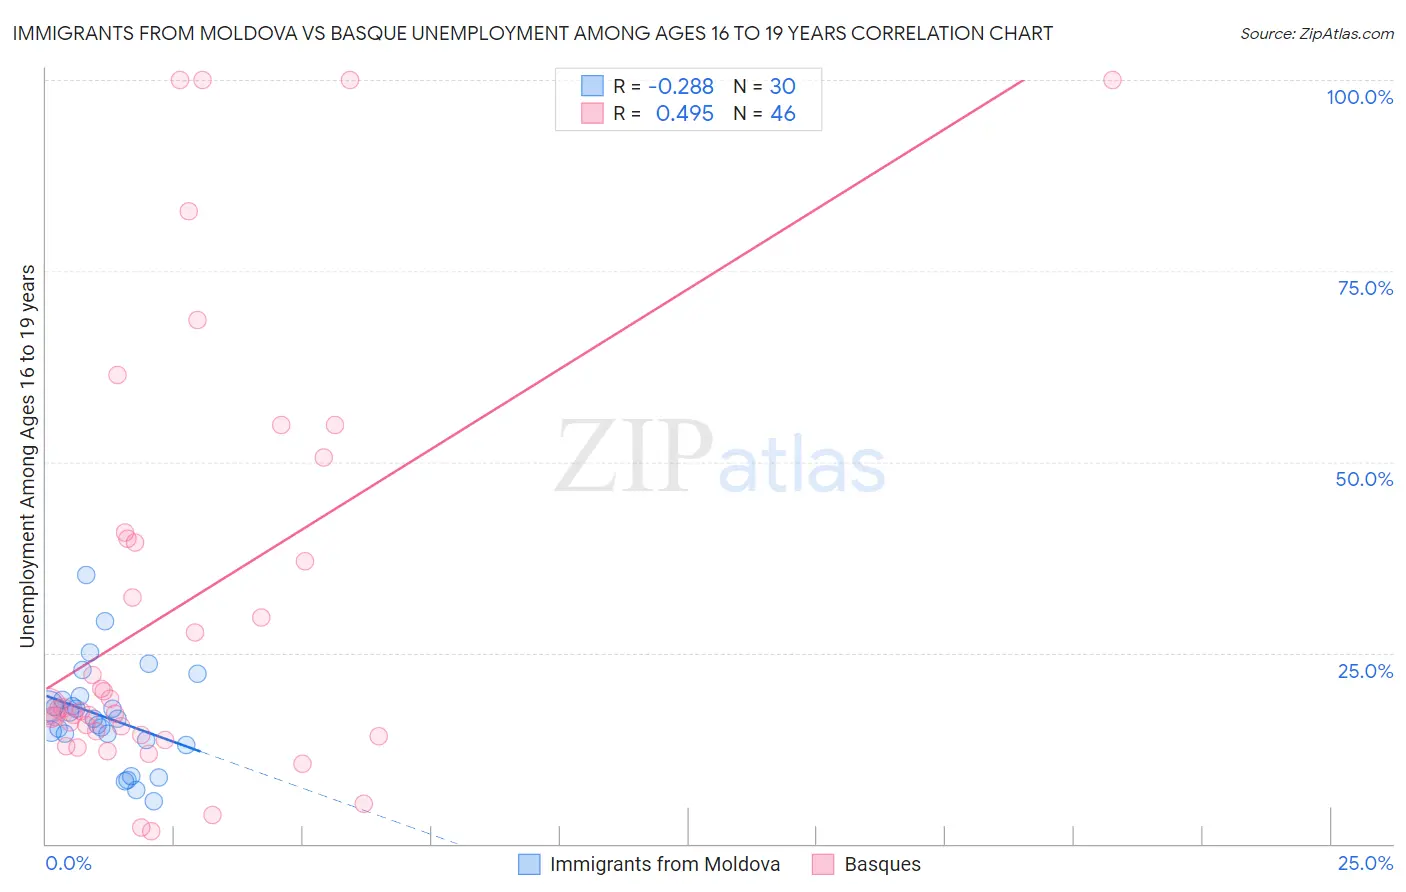
Immigrants from Moldova vs Basque Unemployment Among Ages 16 to 19 years Correlation Chart
The statistical analysis conducted on geographies consisting of 121,441,802 people shows a weak negative correlation between the proportion of Immigrants from Moldova and unemployment rate among population between the ages 16 and 19 in the United States with a correlation coefficient (R) of -0.288 and weighted average of 17.1%. Similarly, the statistical analysis conducted on geographies consisting of 161,898,143 people shows a moderate positive correlation between the proportion of Basques and unemployment rate among population between the ages 16 and 19 in the United States with a correlation coefficient (R) of 0.495 and weighted average of 17.3%, a difference of 1.0%.
Unemployment Among Ages 16 to 19 years Correlation Summary
| Measurement | Immigrants from Moldova | Basque |
| Minimum | 5.6% | 1.6% |
| Maximum | 35.3% | 100.0% |
| Range | 29.7% | 98.4% |
| Mean | 16.6% | 31.1% |
| Median | 16.4% | 17.7% |
| Interquartile 25% (IQ1) | 13.6% | 14.3% |
| Interquartile 75% (IQ3) | 18.8% | 39.9% |
| Interquartile Range (IQR) | 5.2% | 25.6% |
| Standard Deviation (Sample) | 6.5% | 27.8% |
| Standard Deviation (Population) | 6.4% | 27.5% |
Demographics Similar to Immigrants from Moldova and Basques by Unemployment Among Ages 16 to 19 years
In terms of unemployment among ages 16 to 19 years, the demographic groups most similar to Immigrants from Moldova are Immigrants from South Eastern Asia (17.1%, a difference of 0.010%), Immigrants from Laos (17.1%, a difference of 0.26%), Syrian (17.1%, a difference of 0.28%), Immigrants from Germany (17.2%, a difference of 0.39%), and Immigrants from Bolivia (17.2%, a difference of 0.49%). Similarly, the demographic groups most similar to Basques are Immigrants from Croatia (17.3%, a difference of 0.010%), Immigrants from Eritrea (17.3%, a difference of 0.030%), Bolivian (17.3%, a difference of 0.10%), Immigrants from Malaysia (17.2%, a difference of 0.17%), and Immigrants from Oceania (17.2%, a difference of 0.19%).
| Demographics | Rating | Rank | Unemployment Among Ages 16 to 19 years |
| Immigrants | Moldova | 90.7 /100 | #121 | Exceptional 17.1% |
| Immigrants | South Eastern Asia | 90.7 /100 | #122 | Exceptional 17.1% |
| Immigrants | Laos | 88.8 /100 | #123 | Excellent 17.1% |
| Syrians | 88.6 /100 | #124 | Excellent 17.1% |
| Immigrants | Germany | 87.7 /100 | #125 | Excellent 17.2% |
| Immigrants | Bolivia | 86.7 /100 | #126 | Excellent 17.2% |
| Pakistanis | 85.8 /100 | #127 | Excellent 17.2% |
| Australians | 85.6 /100 | #128 | Excellent 17.2% |
| Creek | 85.5 /100 | #129 | Excellent 17.2% |
| Immigrants | Indonesia | 84.7 /100 | #130 | Excellent 17.2% |
| German Russians | 84.1 /100 | #131 | Excellent 17.2% |
| Arabs | 83.9 /100 | #132 | Excellent 17.2% |
| Laotians | 83.9 /100 | #133 | Excellent 17.2% |
| Potawatomi | 83.8 /100 | #134 | Excellent 17.2% |
| Samoans | 83.7 /100 | #135 | Excellent 17.2% |
| Immigrants | Oceania | 83.1 /100 | #136 | Excellent 17.2% |
| Immigrants | Malaysia | 82.8 /100 | #137 | Excellent 17.2% |
| Bolivians | 81.9 /100 | #138 | Excellent 17.3% |
| Immigrants | Eritrea | 81.1 /100 | #139 | Excellent 17.3% |
| Immigrants | Croatia | 80.8 /100 | #140 | Excellent 17.3% |
| Basques | 80.7 /100 | #141 | Excellent 17.3% |