Immigrants from Middle Africa vs Immigrants from Zimbabwe Unemployment Among Ages 35 to 44 years

COMPARE

Immigrants from Middle Africa
Race
Ancestry
AfghanAfricanAlaska NativeAlaskan AthabascanAlbanianAleutAlsatianAmericanApacheArabArapahoArgentineanArmenianAssyrian/Chaldean/SyriacAustralianAustrianBahamianBangladeshiBarbadianBasqueBelgianBelizeanBermudanBhutaneseBlackfeetBolivianBrazilianBritishBritish West IndianBulgarianBurmeseCajunCambodianCanadianCape VerdeanCarpatho RusynCelticCentral AmericanCentral American IndianCherokeeCheyenneChickasawChileanChineseChippewaChoctawColombianColvilleComancheCosta RicanCreeCreekCroatianCrowCubanCypriotCzechCzechoslovakianDanishDelawareDominicanDutchDutch West IndianEastern EuropeanEcuadorianEgyptianEnglishEstonianEthiopianEuropeanFijianFilipinoFinnishFrenchFrench American IndianFrench CanadianGermanGerman RussianGhanaianGreekGuamanian/ChamorroGuatemalanGuyaneseHaitianHmongHonduranHopiHoumaHungarianIcelanderIndian (Asian)IndonesianInupiatIranianIraqiIrishIroquoisIsraeliItalianJamaicanJapaneseJordanianKenyanKiowaKoreanLaotianLatvianLebaneseLiberianLithuanianLumbeeLuxembourgerMacedonianMalaysianMalteseMarshalleseMenomineeMexicanMexican American IndianMongolianMoroccanNative HawaiianNavajoNepaleseNew ZealanderNicaraguanNigerianNorthern EuropeanNorwegianOkinawanOsageOttawaPaiutePakistaniPalestinianPanamanianParaguayanPennsylvania GermanPeruvianPimaPolishPortuguesePotawatomiPuebloPuerto RicanPuget Sound SalishRomanianRussianSalvadoranSamoanScandinavianScotch-IrishScottishSeminoleSenegaleseSerbianShoshoneSierra LeoneanSiouxSlavicSlovakSloveneSomaliSouth AfricanSouth AmericanSouth American IndianSoviet UnionSpaniardSpanishSpanish AmericanSpanish American IndianSri LankanSubsaharan AfricanSudaneseSwedishSwissSyrianTaiwaneseThaiTlingit-HaidaTohono O'OdhamTonganTrinidadian and TobagonianTsimshianTurkishU.S. Virgin IslanderUgandanUkrainianUruguayanUteVenezuelanVietnameseWelshWest IndianYakamaYaquiYugoslavianYumanYup'ikZimbabwean
Immigration
NonimmigrantsImmigrantsAfghanistanAfricaAlbaniaArgentinaArmeniaAsiaAustraliaAustriaBahamasBangladeshBarbadosBelarusBelgiumBelizeBoliviaBosnia and HerzegovinaBrazilBulgariaBurma/MyanmarCabo VerdeCambodiaCameroonCanadaCaribbeanCentral AmericaChileChinaColombiaCongoCosta RicaCroatiaCubaCzechoslovakiaDenmarkDominicaDominican RepublicEastern AfricaEastern AsiaEastern EuropeEcuadorEgyptEl SalvadorEnglandEritreaEthiopiaEuropeFijiFranceGermanyGhanaGreeceGrenadaGuatemalaGuyanaHaitiHondurasHong KongHungaryIndiaIndonesiaIranIraqIrelandIsraelItalyJamaicaJapanJordanKazakhstanKenyaKoreaKuwaitLaosLatin AmericaLatviaLebanonLiberiaLithuaniaMalaysiaMexicoMicronesiaMiddle AfricaMoldovaMoroccoNepalNetherlandsNicaraguaNigeriaNorth AmericaNorth MacedoniaNorthern AfricaNorthern EuropeNorwayOceaniaPakistanPanamaPeruPhilippinesPolandPortugalRomaniaRussiaSaudi ArabiaScotlandSenegalSerbiaSierra LeoneSingaporeSomaliaSouth AfricaSouth AmericaSouth Central AsiaSouth Eastern AsiaSouthern EuropeSpainSri LankaSt. Vincent and the GrenadinesSudanSwedenSwitzerlandSyriaTaiwanThailandTrinidad and TobagoTurkeyUgandaUkraineUruguayUzbekistanVenezuelaVietnamWest IndiesWestern AfricaWestern AsiaWestern EuropeYemenZaireAzores
Immigrants from Zimbabwe
Race
Ancestry
AfghanAfricanAlaska NativeAlaskan AthabascanAlbanianAleutAlsatianAmericanApacheArabArapahoArgentineanArmenianAssyrian/Chaldean/SyriacAustralianAustrianBahamianBangladeshiBarbadianBasqueBelgianBelizeanBermudanBhutaneseBlackfeetBolivianBrazilianBritishBritish West IndianBulgarianBurmeseCajunCambodianCanadianCape VerdeanCarpatho RusynCelticCentral AmericanCentral American IndianCherokeeCheyenneChickasawChileanChineseChippewaChoctawColombianColvilleComancheCosta RicanCreeCreekCroatianCrowCubanCypriotCzechCzechoslovakianDanishDelawareDominicanDutchDutch West IndianEastern EuropeanEcuadorianEgyptianEnglishEstonianEthiopianEuropeanFijianFilipinoFinnishFrenchFrench American IndianFrench CanadianGermanGerman RussianGhanaianGreekGuamanian/ChamorroGuatemalanGuyaneseHaitianHmongHonduranHopiHoumaHungarianIcelanderIndian (Asian)IndonesianInupiatIranianIraqiIrishIroquoisIsraeliItalianJamaicanJapaneseJordanianKenyanKiowaKoreanLaotianLatvianLebaneseLiberianLithuanianLumbeeLuxembourgerMacedonianMalaysianMalteseMarshalleseMenomineeMexicanMexican American IndianMongolianMoroccanNative HawaiianNavajoNepaleseNew ZealanderNicaraguanNigerianNorthern EuropeanNorwegianOkinawanOsageOttawaPaiutePakistaniPalestinianPanamanianParaguayanPennsylvania GermanPeruvianPimaPolishPortuguesePotawatomiPuebloPuerto RicanPuget Sound SalishRomanianRussianSalvadoranSamoanScandinavianScotch-IrishScottishSeminoleSenegaleseSerbianShoshoneSierra LeoneanSiouxSlavicSlovakSloveneSomaliSouth AfricanSouth AmericanSouth American IndianSoviet UnionSpaniardSpanishSpanish AmericanSpanish American IndianSri LankanSubsaharan AfricanSudaneseSwedishSwissSyrianTaiwaneseThaiTlingit-HaidaTohono O'OdhamTonganTrinidadian and TobagonianTsimshianTurkishU.S. Virgin IslanderUgandanUkrainianUruguayanUteVenezuelanVietnameseWelshWest IndianYakamaYaquiYugoslavianYumanYup'ikZimbabwean
Immigration
NonimmigrantsImmigrantsAfghanistanAfricaAlbaniaArgentinaArmeniaAsiaAustraliaAustriaBahamasBangladeshBarbadosBelarusBelgiumBelizeBoliviaBosnia and HerzegovinaBrazilBulgariaBurma/MyanmarCabo VerdeCambodiaCameroonCanadaCaribbeanCentral AmericaChileChinaColombiaCongoCosta RicaCroatiaCubaCzechoslovakiaDenmarkDominicaDominican RepublicEastern AfricaEastern AsiaEastern EuropeEcuadorEgyptEl SalvadorEnglandEritreaEthiopiaEuropeFijiFranceGermanyGhanaGreeceGrenadaGuatemalaGuyanaHaitiHondurasHong KongHungaryIndiaIndonesiaIranIraqIrelandIsraelItalyJamaicaJapanJordanKazakhstanKenyaKoreaKuwaitLaosLatin AmericaLatviaLebanonLiberiaLithuaniaMalaysiaMexicoMicronesiaMoldovaMoroccoNepalNetherlandsNicaraguaNigeriaNorth AmericaNorth MacedoniaNorthern AfricaNorthern EuropeNorwayOceaniaPakistanPanamaPeruPhilippinesPolandPortugalRomaniaRussiaSaudi ArabiaScotlandSenegalSerbiaSierra LeoneSingaporeSomaliaSouth AfricaSouth AmericaSouth Central AsiaSouth Eastern AsiaSouthern EuropeSpainSri LankaSt. Vincent and the GrenadinesSudanSwedenSwitzerlandSyriaTaiwanThailandTrinidad and TobagoTurkeyUgandaUkraineUruguayUzbekistanVenezuelaVietnamWest IndiesWestern AfricaWestern AsiaWestern EuropeYemenZaireZimbabweAzores
Unemployment Among Ages 35 to 44 years
Income
Poverty
Unemployment
Labor Participation
Family Structure
Vehicle Availability
Education Level
Disability

Unemployment Among Ages 35 to 44 years Comparison

Immigrants from Middle Africa

Immigrants from Zimbabwe

Fair
Exceptional
4.8%
UNEMPLOYMENT AMONG AGES 35 TO 44 YEARS
21.9/ 100
METRIC RATING
199th/ 347
METRIC RANK
4.3%
UNEMPLOYMENT AMONG AGES 35 TO 44 YEARS
98.9/ 100
METRIC RATING
37th/ 347
METRIC RANK

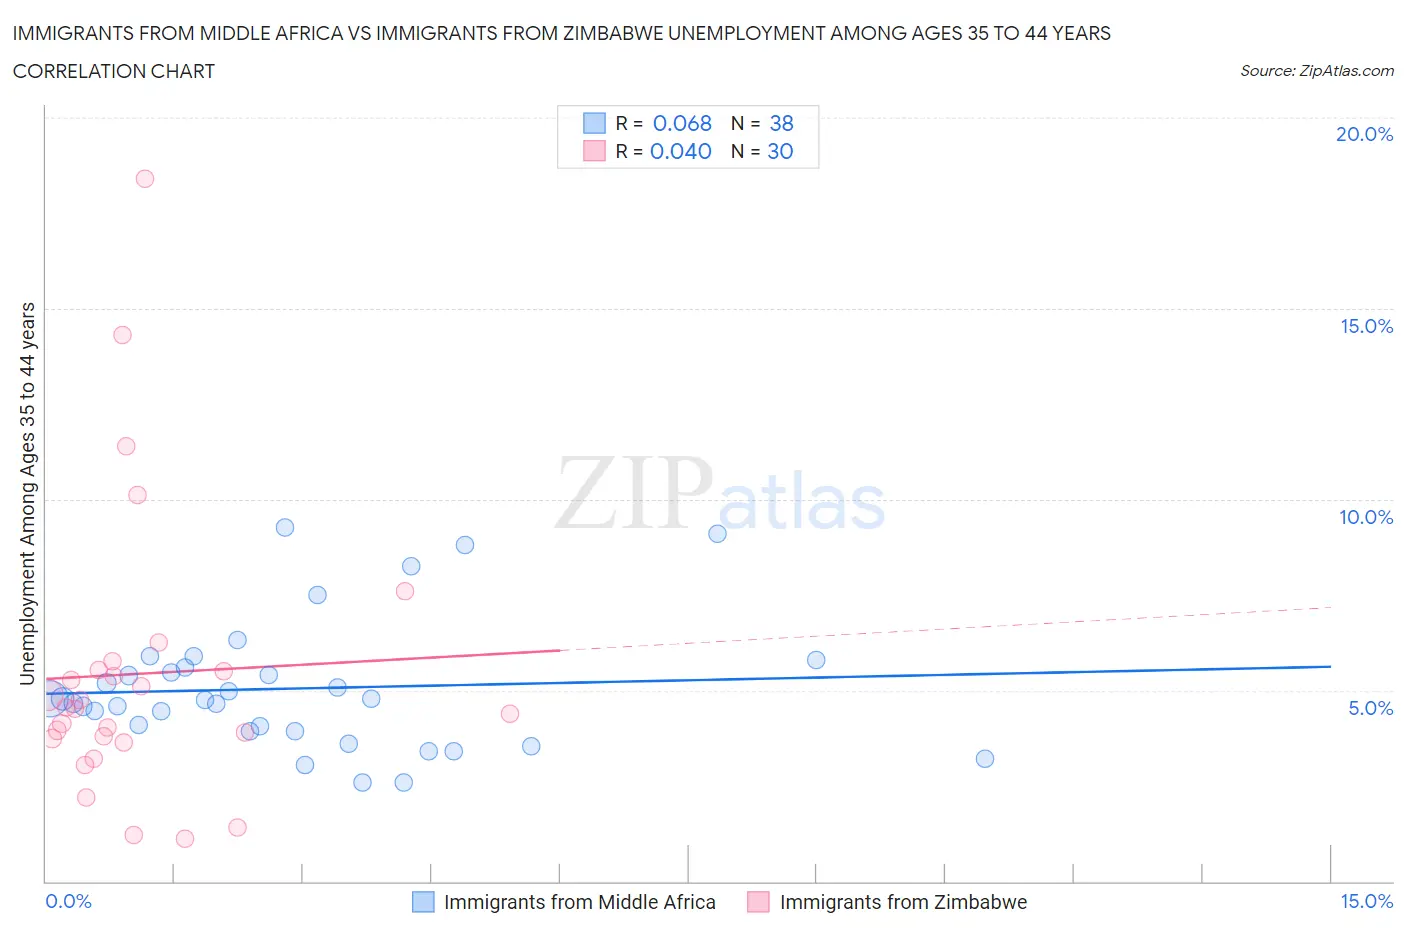
Immigrants from Middle Africa vs Immigrants from Zimbabwe Unemployment Among Ages 35 to 44 years Correlation Chart

The statistical analysis conducted on geographies consisting of 201,129,031 people shows a slight positive correlation between the proportion of Immigrants from Middle Africa and unemployment rate among population between the ages 35 and 44 in the United States with a correlation coefficient (R) of 0.068 and weighted average of 4.8%. Similarly, the statistical analysis conducted on geographies consisting of 117,069,210 people shows no correlation between the proportion of Immigrants from Zimbabwe and unemployment rate among population between the ages 35 and 44 in the United States with a correlation coefficient (R) of 0.040 and weighted average of 4.3%, a difference of 11.1%.
Immigrants from Middle Africa vs Immigrants from Zimbabwe Unemployment Among Ages 35 to 44 years

Unemployment Among Ages 35 to 44 years Correlation Summary

MeasurementImmigrants from Middle AfricaImmigrants from Zimbabwe
Minimum2.6%1.1%
Maximum9.3%18.4%
Range6.7%17.3%
Mean5.0%5.4%
Median4.8%4.5%
Interquartile 25% (IQ1)3.9%3.7%
Interquartile 75% (IQ3)5.6%5.5%
Interquartile Range (IQR)1.7%1.8%
Standard Deviation (Sample)1.7%3.7%
Standard Deviation (Population)1.7%3.7%

Similar Demographics by Unemployment Among Ages 35 to 44 years

Demographics Similar to Immigrants from Middle Africa by Unemployment Among Ages 35 to 44 years

In terms of unemployment among ages 35 to 44 years, the demographic groups most similar to Immigrants from Middle Africa are Immigrants from Ukraine (4.8%, a difference of 0.050%), Ugandan (4.8%, a difference of 0.050%), Immigrants from Thailand (4.8%, a difference of 0.10%), Immigrants from Oceania (4.8%, a difference of 0.13%), and Immigrants from Syria (4.8%, a difference of 0.17%).
DemographicsRating | RankUnemployment Among Ages 35 to 44 years
Immigrants | Albania
30.5
/100
|
#192
Fair
4.8%
Spanish
30.4
/100
|
#193
Fair
4.8%
Koreans
28.1
/100
|
#194
Fair
4.8%
Bangladeshis
28.0
/100
|
#195
Fair
4.8%
Immigrants | Syria
23.6
/100
|
#196
Fair
4.8%
Immigrants | Oceania
23.2
/100
|
#197
Fair
4.8%
Immigrants | Thailand
22.9
/100
|
#198
Fair
4.8%
Immigrants | Middle Africa
21.9
/100
|
#199
Fair
4.8%
Immigrants | Ukraine
21.4
/100
|
#200
Fair
4.8%
Ugandans
21.4
/100
|
#201
Fair
4.8%
Immigrants | Afghanistan
20.2
/100
|
#202
Fair
4.8%
Uruguayans
20.0
/100
|
#203
Fair
4.8%
Immigrants | Philippines
19.8
/100
|
#204
Poor
4.8%
Spaniards
18.7
/100
|
#205
Poor
4.8%
Soviet Union
18.4
/100
|
#206
Poor
4.8%

Demographics Similar to Immigrants from Zimbabwe by Unemployment Among Ages 35 to 44 years

In terms of unemployment among ages 35 to 44 years, the demographic groups most similar to Immigrants from Zimbabwe are Mongolian (4.3%, a difference of 0.050%), Burmese (4.3%, a difference of 0.070%), Palestinian (4.3%, a difference of 0.13%), Luxembourger (4.3%, a difference of 0.15%), and Jordanian (4.3%, a difference of 0.18%).
DemographicsRating | RankUnemployment Among Ages 35 to 44 years
Immigrants | Pakistan
99.2
/100
|
#30
Exceptional
4.3%
Carpatho Rusyns
99.2
/100
|
#31
Exceptional
4.3%
Chinese
99.1
/100
|
#32
Exceptional
4.3%
Immigrants | Sri Lanka
99.1
/100
|
#33
Exceptional
4.3%
Jordanians
99.0
/100
|
#34
Exceptional
4.3%
Luxembourgers
99.0
/100
|
#35
Exceptional
4.3%
Mongolians
98.9
/100
|
#36
Exceptional
4.3%
Immigrants | Zimbabwe
98.9
/100
|
#37
Exceptional
4.3%
Burmese
98.9
/100
|
#38
Exceptional
4.3%
Palestinians
98.8
/100
|
#39
Exceptional
4.3%
Zimbabweans
98.8
/100
|
#40
Exceptional
4.3%
Belgians
98.7
/100
|
#41
Exceptional
4.3%
Germans
98.7
/100
|
#42
Exceptional
4.3%
Eastern Europeans
98.7
/100
|
#43
Exceptional
4.3%
Immigrants | Malaysia
98.7
/100
|
#44
Exceptional
4.3%