Immigrants from Mexico vs Alaskan Athabascan Unemployment Among Ages 45 to 54 years
COMPARE
Immigrants from Mexico
Alaskan Athabascan
Unemployment Among Ages 45 to 54 years
Unemployment Among Ages 45 to 54 years Comparison
Immigrants from Mexico
Alaskan Athabascans
5.0%
UNEMPLOYMENT AMONG AGES 45 TO 54 YEARS
0.0/ 100
METRIC RATING
277th/ 347
METRIC RANK
8.5%
UNEMPLOYMENT AMONG AGES 45 TO 54 YEARS
0.0/ 100
METRIC RATING
342nd/ 347
METRIC RANK
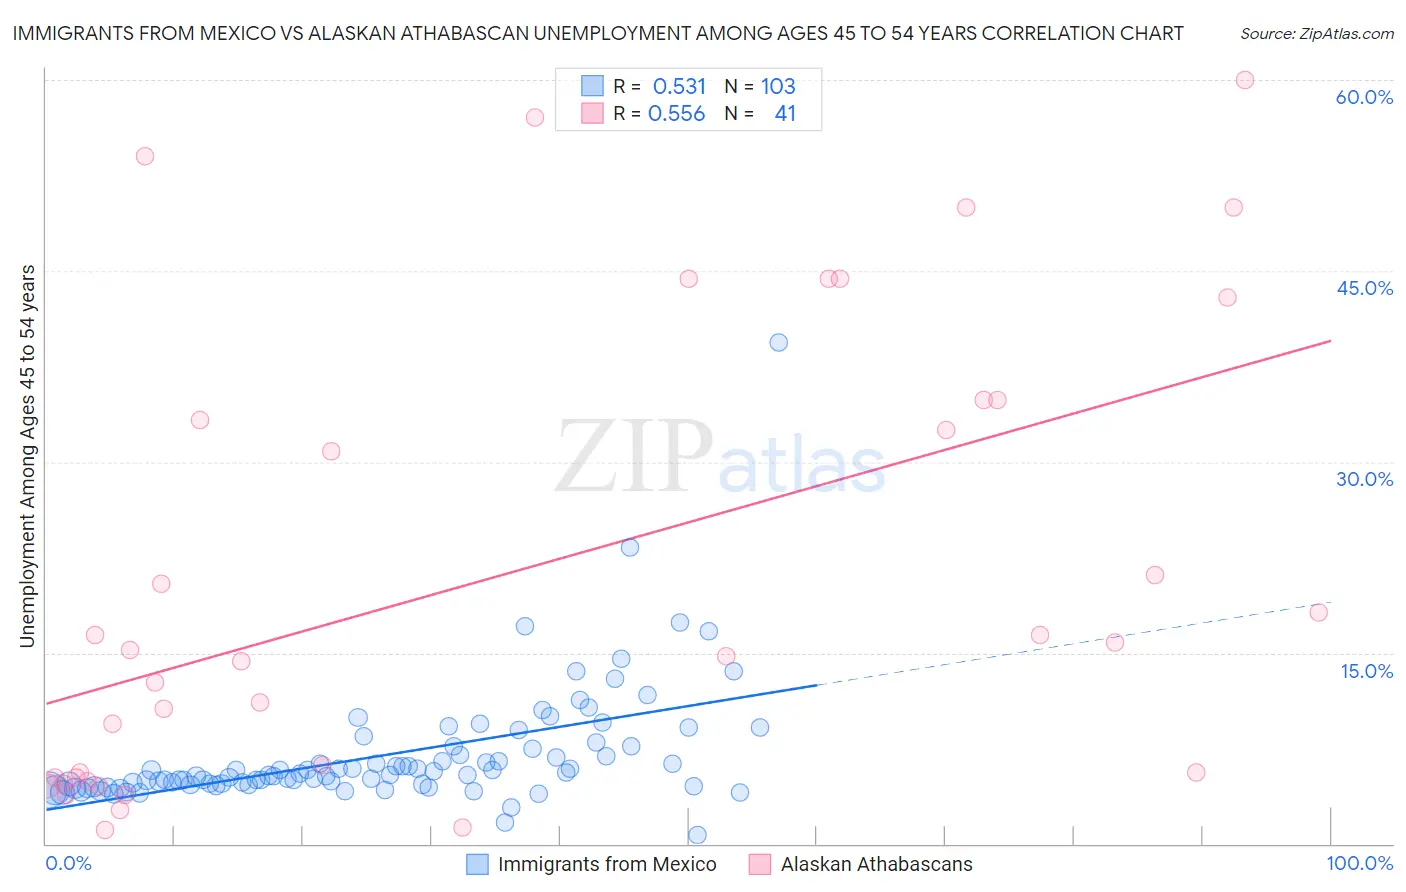
Immigrants from Mexico vs Alaskan Athabascan Unemployment Among Ages 45 to 54 years Correlation Chart
The statistical analysis conducted on geographies consisting of 487,247,960 people shows a substantial positive correlation between the proportion of Immigrants from Mexico and unemployment rate among population between the ages 45 and 54 in the United States with a correlation coefficient (R) of 0.531 and weighted average of 5.0%. Similarly, the statistical analysis conducted on geographies consisting of 45,433,240 people shows a substantial positive correlation between the proportion of Alaskan Athabascans and unemployment rate among population between the ages 45 and 54 in the United States with a correlation coefficient (R) of 0.556 and weighted average of 8.5%, a difference of 68.4%.
Unemployment Among Ages 45 to 54 years Correlation Summary
| Measurement | Immigrants from Mexico | Alaskan Athabascan |
| Minimum | 0.70% | 1.1% |
| Maximum | 39.4% | 60.0% |
| Range | 38.7% | 58.9% |
| Mean | 6.9% | 21.2% |
| Median | 5.4% | 15.2% |
| Interquartile 25% (IQ1) | 4.7% | 5.2% |
| Interquartile 75% (IQ3) | 7.5% | 34.9% |
| Interquartile Range (IQR) | 2.8% | 29.7% |
| Standard Deviation (Sample) | 4.7% | 18.1% |
| Standard Deviation (Population) | 4.7% | 17.8% |
Similar Demographics by Unemployment Among Ages 45 to 54 years
Demographics Similar to Immigrants from Mexico by Unemployment Among Ages 45 to 54 years
In terms of unemployment among ages 45 to 54 years, the demographic groups most similar to Immigrants from Mexico are French American Indian (5.0%, a difference of 0.13%), Dutch West Indian (5.0%, a difference of 0.21%), Nepalese (5.0%, a difference of 0.34%), Blackfeet (5.1%, a difference of 0.55%), and Spanish American Indian (5.1%, a difference of 0.63%).
| Demographics | Rating | Rank | Unemployment Among Ages 45 to 54 years |
| Immigrants | Ghana | 0.0 /100 | #270 | Tragic 5.0% |
| Cajuns | 0.0 /100 | #271 | Tragic 5.0% |
| Immigrants | Central America | 0.0 /100 | #272 | Tragic 5.0% |
| Immigrants | Latin America | 0.0 /100 | #273 | Tragic 5.0% |
| U.S. Virgin Islanders | 0.0 /100 | #274 | Tragic 5.0% |
| Bermudans | 0.0 /100 | #275 | Tragic 5.0% |
| French American Indians | 0.0 /100 | #276 | Tragic 5.0% |
| Immigrants | Mexico | 0.0 /100 | #277 | Tragic 5.0% |
| Dutch West Indians | 0.0 /100 | #278 | Tragic 5.0% |
| Nepalese | 0.0 /100 | #279 | Tragic 5.0% |
| Blackfeet | 0.0 /100 | #280 | Tragic 5.1% |
| Spanish American Indians | 0.0 /100 | #281 | Tragic 5.1% |
| Africans | 0.0 /100 | #282 | Tragic 5.1% |
| Hispanics or Latinos | 0.0 /100 | #283 | Tragic 5.1% |
| Kiowa | 0.0 /100 | #284 | Tragic 5.1% |
Demographics Similar to Alaskan Athabascans by Unemployment Among Ages 45 to 54 years
In terms of unemployment among ages 45 to 54 years, the demographic groups most similar to Alaskan Athabascans are Inupiat (9.2%, a difference of 8.6%), Paiute (7.8%, a difference of 8.8%), Yuman (9.5%, a difference of 12.2%), Hopi (7.5%, a difference of 12.6%), and Arapaho (7.5%, a difference of 13.1%).
| Demographics | Rating | Rank | Unemployment Among Ages 45 to 54 years |
| Immigrants | Yemen | 0.0 /100 | #333 | Tragic 6.5% |
| Sioux | 0.0 /100 | #334 | Tragic 6.6% |
| Navajo | 0.0 /100 | #335 | Tragic 6.7% |
| Puerto Ricans | 0.0 /100 | #336 | Tragic 6.8% |
| Apache | 0.0 /100 | #337 | Tragic 7.0% |
| Colville | 0.0 /100 | #338 | Tragic 7.4% |
| Arapaho | 0.0 /100 | #339 | Tragic 7.5% |
| Hopi | 0.0 /100 | #340 | Tragic 7.5% |
| Paiute | 0.0 /100 | #341 | Tragic 7.8% |
| Alaskan Athabascans | 0.0 /100 | #342 | Tragic 8.5% |
| Inupiat | 0.0 /100 | #343 | Tragic 9.2% |
| Yuman | 0.0 /100 | #344 | Tragic 9.5% |
| Cheyenne | 0.0 /100 | #345 | Tragic 10.6% |
| Yup'ik | 0.0 /100 | #346 | Tragic 11.9% |
| Crow | 0.0 /100 | #347 | Tragic 13.7% |