Immigrants from Lithuania vs Immigrants from Congo Unemployment Among Women with Children Ages 6 to 17 years
COMPARE
Immigrants from Lithuania
Immigrants from Congo
Unemployment Among Women with Children Ages 6 to 17 years
Unemployment Among Women with Children Ages 6 to 17 years Comparison
Immigrants from Lithuania
Immigrants from Congo
8.6%
UNEMPLOYMENT AMONG WOMEN WITH CHILDREN AGES 6 TO 17 YEARS
98.4/ 100
METRIC RATING
99th/ 347
METRIC RANK
9.0%
UNEMPLOYMENT AMONG WOMEN WITH CHILDREN AGES 6 TO 17 YEARS
32.5/ 100
METRIC RATING
185th/ 347
METRIC RANK
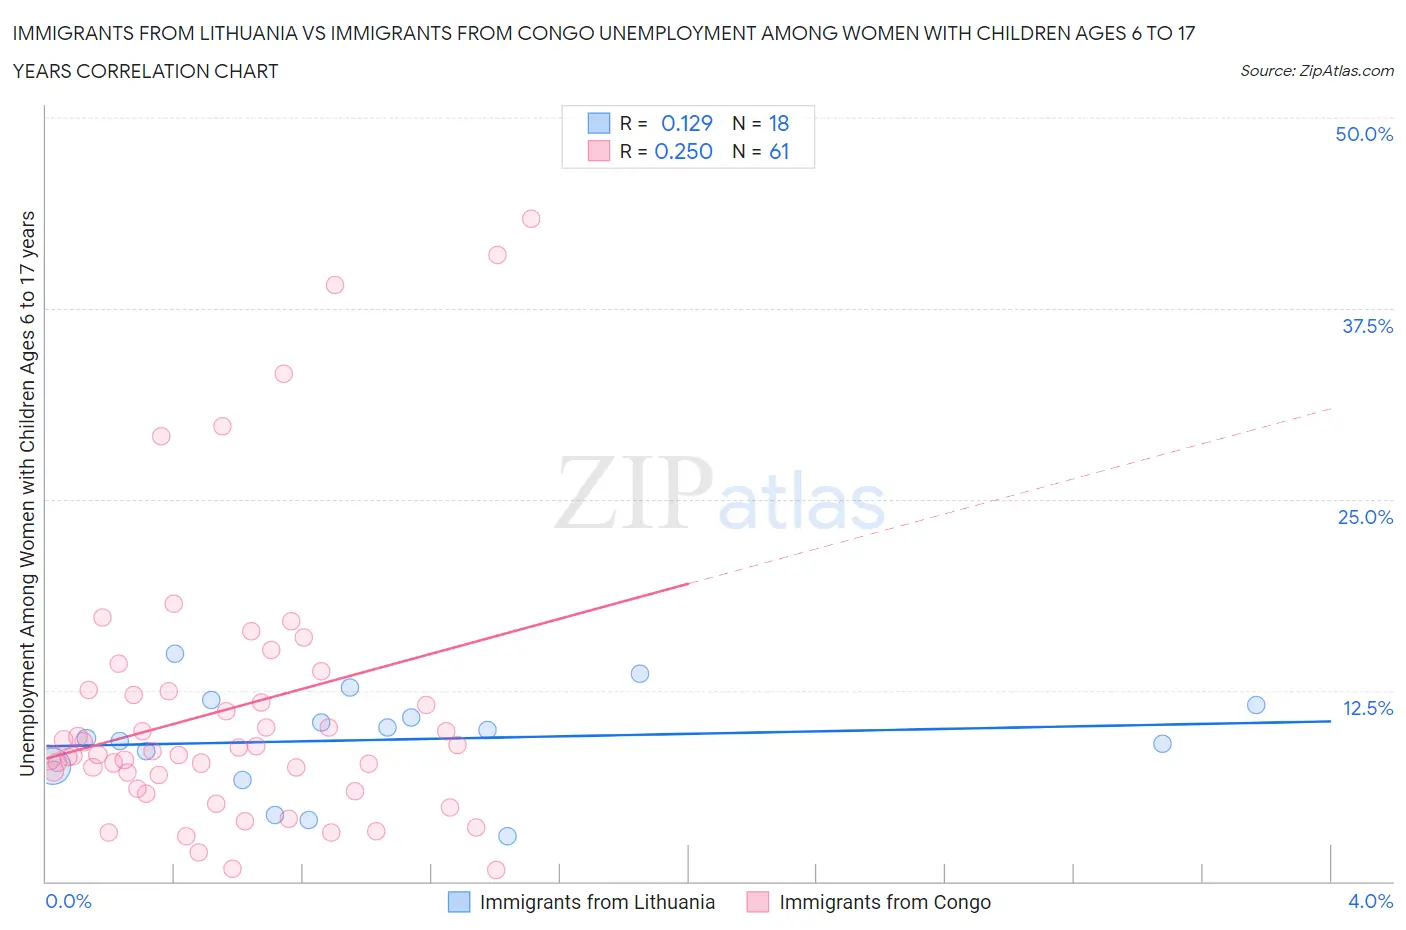
Immigrants from Lithuania vs Immigrants from Congo Unemployment Among Women with Children Ages 6 to 17 years Correlation Chart
The statistical analysis conducted on geographies consisting of 97,683,063 people shows a poor positive correlation between the proportion of Immigrants from Lithuania and unemployment rate among women with children between the ages 6 and 17 in the United States with a correlation coefficient (R) of 0.129 and weighted average of 8.6%. Similarly, the statistical analysis conducted on geographies consisting of 83,229,109 people shows a weak positive correlation between the proportion of Immigrants from Congo and unemployment rate among women with children between the ages 6 and 17 in the United States with a correlation coefficient (R) of 0.250 and weighted average of 9.0%, a difference of 5.6%.
Unemployment Among Women with Children Ages 6 to 17 years Correlation Summary
| Measurement | Immigrants from Lithuania | Immigrants from Congo |
| Minimum | 3.0% | 0.70% |
| Maximum | 14.9% | 43.4% |
| Range | 12.0% | 42.7% |
| Mean | 9.3% | 11.3% |
| Median | 9.6% | 8.5% |
| Interquartile 25% (IQ1) | 7.5% | 6.5% |
| Interquartile 75% (IQ3) | 11.5% | 12.5% |
| Interquartile Range (IQR) | 4.0% | 5.9% |
| Standard Deviation (Sample) | 3.3% | 9.3% |
| Standard Deviation (Population) | 3.2% | 9.2% |
Similar Demographics by Unemployment Among Women with Children Ages 6 to 17 years
Demographics Similar to Immigrants from Lithuania by Unemployment Among Women with Children Ages 6 to 17 years
In terms of unemployment among women with children ages 6 to 17 years, the demographic groups most similar to Immigrants from Lithuania are New Zealander (8.6%, a difference of 0.0%), Immigrants from Pakistan (8.6%, a difference of 0.0%), Immigrants from South Africa (8.6%, a difference of 0.030%), Scandinavian (8.6%, a difference of 0.040%), and Malaysian (8.6%, a difference of 0.080%).
| Demographics | Rating | Rank | Unemployment Among Women with Children Ages 6 to 17 years |
| Potawatomi | 99.0 /100 | #92 | Exceptional 8.5% |
| Australians | 98.9 /100 | #93 | Exceptional 8.5% |
| Immigrants | Barbados | 98.8 /100 | #94 | Exceptional 8.5% |
| Sri Lankans | 98.7 /100 | #95 | Exceptional 8.5% |
| German Russians | 98.6 /100 | #96 | Exceptional 8.5% |
| Bolivians | 98.5 /100 | #97 | Exceptional 8.5% |
| Malaysians | 98.5 /100 | #98 | Exceptional 8.6% |
| Immigrants | Lithuania | 98.4 /100 | #99 | Exceptional 8.6% |
| New Zealanders | 98.4 /100 | #100 | Exceptional 8.6% |
| Immigrants | Pakistan | 98.4 /100 | #101 | Exceptional 8.6% |
| Immigrants | South Africa | 98.3 /100 | #102 | Exceptional 8.6% |
| Scandinavians | 98.3 /100 | #103 | Exceptional 8.6% |
| Immigrants | France | 98.0 /100 | #104 | Exceptional 8.6% |
| Immigrants | Norway | 97.8 /100 | #105 | Exceptional 8.6% |
| Immigrants | Serbia | 97.7 /100 | #106 | Exceptional 8.6% |
Demographics Similar to Immigrants from Congo by Unemployment Among Women with Children Ages 6 to 17 years
In terms of unemployment among women with children ages 6 to 17 years, the demographic groups most similar to Immigrants from Congo are Immigrants from Spain (9.0%, a difference of 0.010%), Palestinian (9.0%, a difference of 0.040%), Swiss (9.0%, a difference of 0.050%), South American Indian (9.0%, a difference of 0.090%), and Immigrants from Czechoslovakia (9.0%, a difference of 0.10%).
| Demographics | Rating | Rank | Unemployment Among Women with Children Ages 6 to 17 years |
| Menominee | 39.3 /100 | #178 | Fair 9.0% |
| Immigrants | Zaire | 38.3 /100 | #179 | Fair 9.0% |
| Ethiopians | 37.6 /100 | #180 | Fair 9.0% |
| Immigrants | Czechoslovakia | 34.5 /100 | #181 | Fair 9.0% |
| South American Indians | 34.4 /100 | #182 | Fair 9.0% |
| Swiss | 33.5 /100 | #183 | Fair 9.0% |
| Palestinians | 33.4 /100 | #184 | Fair 9.0% |
| Immigrants | Congo | 32.5 /100 | #185 | Fair 9.0% |
| Immigrants | Spain | 32.4 /100 | #186 | Fair 9.0% |
| Comanche | 30.0 /100 | #187 | Fair 9.0% |
| Immigrants | Syria | 29.7 /100 | #188 | Fair 9.1% |
| Immigrants | Immigrants | 29.2 /100 | #189 | Fair 9.1% |
| Slovenes | 28.5 /100 | #190 | Fair 9.1% |
| Belizeans | 28.4 /100 | #191 | Fair 9.1% |
| Guamanians/Chamorros | 27.2 /100 | #192 | Fair 9.1% |