Immigrants from Lithuania vs Blackfeet Unemployment Among Women with Children Under 6 years
COMPARE
Immigrants from Lithuania
Blackfeet
Unemployment Among Women with Children Under 6 years
Unemployment Among Women with Children Under 6 years Comparison
Immigrants from Lithuania
Blackfeet
7.5%
UNEMPLOYMENT AMONG WOMEN WITH CHILDREN UNDER 6 YEARS
68.8/ 100
METRIC RATING
162nd/ 347
METRIC RANK
8.7%
UNEMPLOYMENT AMONG WOMEN WITH CHILDREN UNDER 6 YEARS
0.0/ 100
METRIC RATING
284th/ 347
METRIC RANK
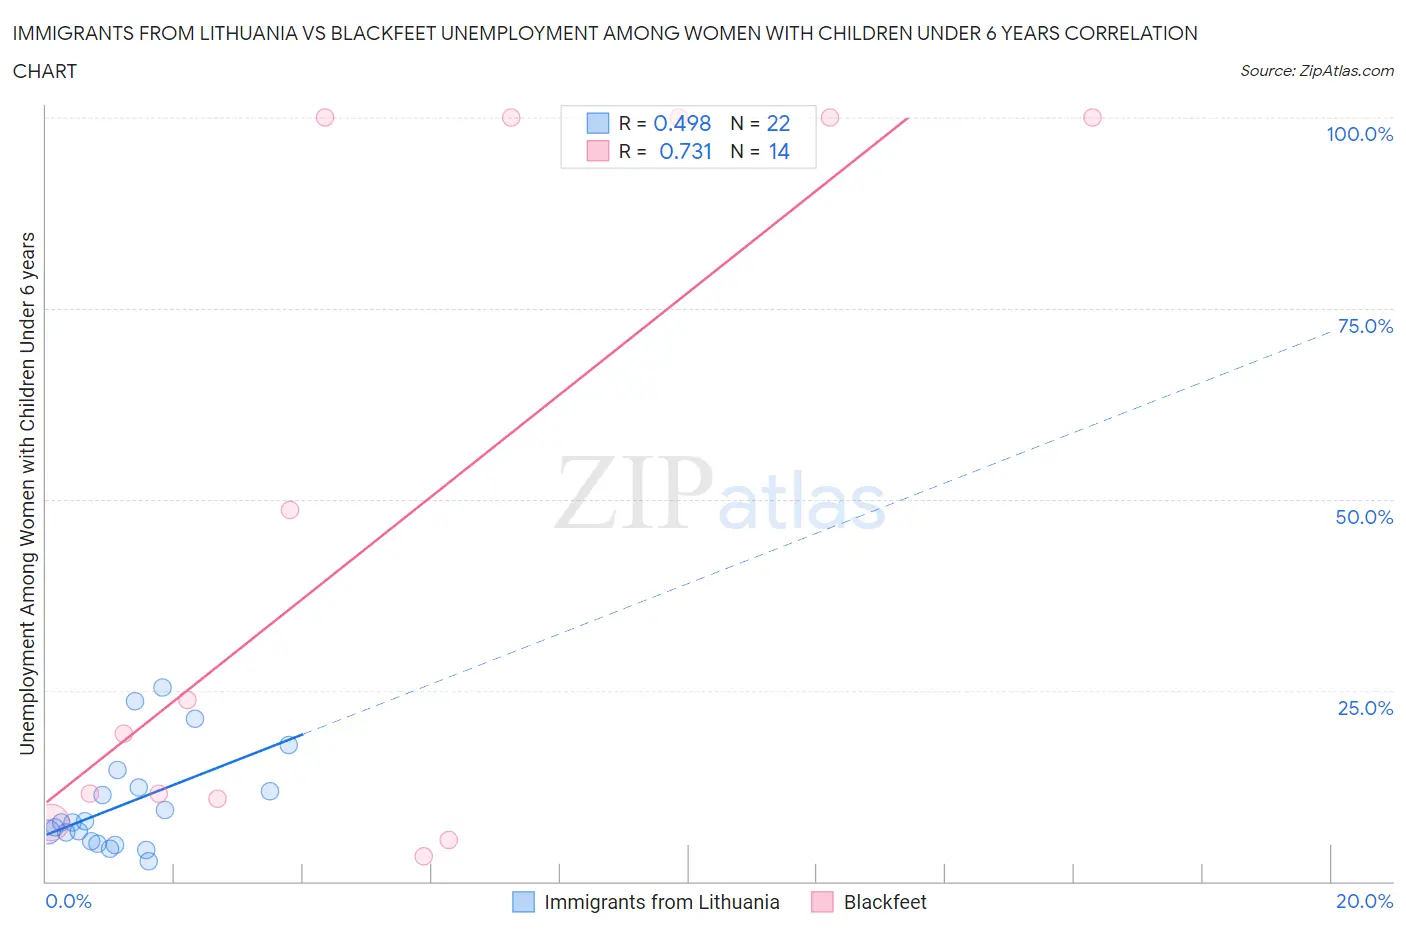
Immigrants from Lithuania vs Blackfeet Unemployment Among Women with Children Under 6 years Correlation Chart
The statistical analysis conducted on geographies consisting of 102,015,606 people shows a moderate positive correlation between the proportion of Immigrants from Lithuania and unemployment rate among women with children under the age of 6 in the United States with a correlation coefficient (R) of 0.498 and weighted average of 7.5%. Similarly, the statistical analysis conducted on geographies consisting of 246,110,374 people shows a strong positive correlation between the proportion of Blackfeet and unemployment rate among women with children under the age of 6 in the United States with a correlation coefficient (R) of 0.731 and weighted average of 8.7%, a difference of 15.1%.
Unemployment Among Women with Children Under 6 years Correlation Summary
| Measurement | Immigrants from Lithuania | Blackfeet |
| Minimum | 2.7% | 3.2% |
| Maximum | 25.3% | 100.0% |
| Range | 22.6% | 96.8% |
| Mean | 10.1% | 45.8% |
| Median | 7.7% | 21.5% |
| Interquartile 25% (IQ1) | 5.2% | 10.7% |
| Interquartile 75% (IQ3) | 12.2% | 100.0% |
| Interquartile Range (IQR) | 7.0% | 89.3% |
| Standard Deviation (Sample) | 6.5% | 43.3% |
| Standard Deviation (Population) | 6.4% | 41.7% |
Similar Demographics by Unemployment Among Women with Children Under 6 years
Demographics Similar to Immigrants from Lithuania by Unemployment Among Women with Children Under 6 years
In terms of unemployment among women with children under 6 years, the demographic groups most similar to Immigrants from Lithuania are Immigrants from Western Asia (7.5%, a difference of 0.12%), Bolivian (7.5%, a difference of 0.16%), British (7.6%, a difference of 0.19%), Immigrants from Philippines (7.5%, a difference of 0.20%), and Ugandan (7.6%, a difference of 0.23%).
| Demographics | Rating | Rank | Unemployment Among Women with Children Under 6 years |
| South Americans | 74.1 /100 | #155 | Good 7.5% |
| Immigrants | Southern Europe | 73.2 /100 | #156 | Good 7.5% |
| Peruvians | 72.3 /100 | #157 | Good 7.5% |
| Croatians | 71.9 /100 | #158 | Good 7.5% |
| Immigrants | Philippines | 71.3 /100 | #159 | Good 7.5% |
| Bolivians | 70.8 /100 | #160 | Good 7.5% |
| Immigrants | Western Asia | 70.2 /100 | #161 | Good 7.5% |
| Immigrants | Lithuania | 68.8 /100 | #162 | Good 7.5% |
| British | 66.3 /100 | #163 | Good 7.6% |
| Ugandans | 65.8 /100 | #164 | Good 7.6% |
| Immigrants | South America | 65.6 /100 | #165 | Good 7.6% |
| Belgians | 63.5 /100 | #166 | Good 7.6% |
| Kenyans | 62.5 /100 | #167 | Good 7.6% |
| Immigrants | Canada | 61.6 /100 | #168 | Good 7.6% |
| Immigrants | Scotland | 61.3 /100 | #169 | Good 7.6% |
Demographics Similar to Blackfeet by Unemployment Among Women with Children Under 6 years
In terms of unemployment among women with children under 6 years, the demographic groups most similar to Blackfeet are Spanish American Indian (8.7%, a difference of 0.16%), Bermudan (8.7%, a difference of 0.18%), U.S. Virgin Islander (8.7%, a difference of 0.20%), Seminole (8.7%, a difference of 0.20%), and Guatemalan (8.7%, a difference of 0.27%).
| Demographics | Rating | Rank | Unemployment Among Women with Children Under 6 years |
| Haitians | 0.0 /100 | #277 | Tragic 8.6% |
| Immigrants | Dominica | 0.0 /100 | #278 | Tragic 8.6% |
| Immigrants | Guatemala | 0.0 /100 | #279 | Tragic 8.6% |
| Immigrants | Belize | 0.0 /100 | #280 | Tragic 8.6% |
| Guatemalans | 0.0 /100 | #281 | Tragic 8.7% |
| Bermudans | 0.0 /100 | #282 | Tragic 8.7% |
| Spanish American Indians | 0.0 /100 | #283 | Tragic 8.7% |
| Blackfeet | 0.0 /100 | #284 | Tragic 8.7% |
| U.S. Virgin Islanders | 0.0 /100 | #285 | Tragic 8.7% |
| Seminole | 0.0 /100 | #286 | Tragic 8.7% |
| Menominee | 0.0 /100 | #287 | Tragic 8.7% |
| Bahamians | 0.0 /100 | #288 | Tragic 8.7% |
| Iroquois | 0.0 /100 | #289 | Tragic 8.7% |
| Vietnamese | 0.0 /100 | #290 | Tragic 8.8% |
| Jamaicans | 0.0 /100 | #291 | Tragic 8.8% |