Immigrants from Liberia vs Immigrants from Japan Unemployment
COMPARE
Immigrants from Liberia
Immigrants from Japan
Unemployment
Unemployment Comparison
Immigrants from Liberia
Immigrants from Japan
5.8%
UNEMPLOYMENT
0.1/ 100
METRIC RATING
264th/ 347
METRIC RANK
4.9%
UNEMPLOYMENT
98.3/ 100
METRIC RATING
71st/ 347
METRIC RANK
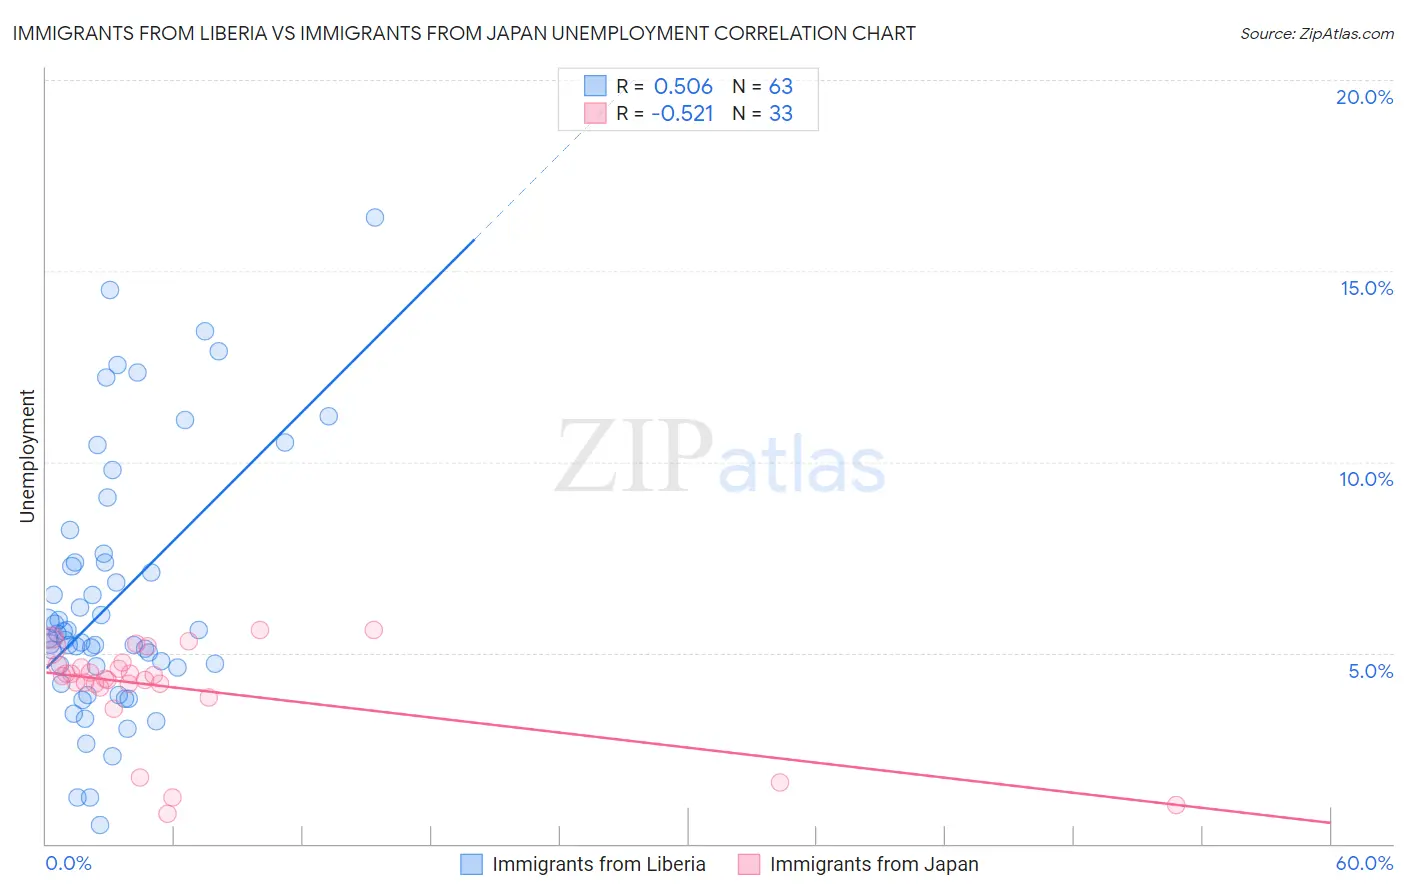
Immigrants from Liberia vs Immigrants from Japan Unemployment Correlation Chart
The statistical analysis conducted on geographies consisting of 135,254,533 people shows a substantial positive correlation between the proportion of Immigrants from Liberia and unemployment in the United States with a correlation coefficient (R) of 0.506 and weighted average of 5.8%. Similarly, the statistical analysis conducted on geographies consisting of 339,966,426 people shows a substantial negative correlation between the proportion of Immigrants from Japan and unemployment in the United States with a correlation coefficient (R) of -0.521 and weighted average of 4.9%, a difference of 17.8%.
Unemployment Correlation Summary
| Measurement | Immigrants from Liberia | Immigrants from Japan |
| Minimum | 0.50% | 0.80% |
| Maximum | 16.4% | 5.6% |
| Range | 15.9% | 4.8% |
| Mean | 6.4% | 4.1% |
| Median | 5.4% | 4.4% |
| Interquartile 25% (IQ1) | 4.6% | 4.1% |
| Interquartile 75% (IQ3) | 7.4% | 4.7% |
| Interquartile Range (IQR) | 2.8% | 0.58% |
| Standard Deviation (Sample) | 3.4% | 1.3% |
| Standard Deviation (Population) | 3.3% | 1.3% |
Similar Demographics by Unemployment
Demographics Similar to Immigrants from Liberia by Unemployment
In terms of unemployment, the demographic groups most similar to Immigrants from Liberia are Nigerian (5.8%, a difference of 0.070%), Salvadoran (5.8%, a difference of 0.090%), Sierra Leonean (5.8%, a difference of 0.13%), Immigrants from Guatemala (5.8%, a difference of 0.23%), and Immigrants from Uzbekistan (5.8%, a difference of 0.25%).
| Demographics | Rating | Rank | Unemployment |
| Yaqui | 0.2 /100 | #257 | Tragic 5.8% |
| Immigrants | Bahamas | 0.1 /100 | #258 | Tragic 5.8% |
| Sub-Saharan Africans | 0.1 /100 | #259 | Tragic 5.8% |
| Immigrants | Uzbekistan | 0.1 /100 | #260 | Tragic 5.8% |
| Immigrants | Guatemala | 0.1 /100 | #261 | Tragic 5.8% |
| Sierra Leoneans | 0.1 /100 | #262 | Tragic 5.8% |
| Salvadorans | 0.1 /100 | #263 | Tragic 5.8% |
| Immigrants | Liberia | 0.1 /100 | #264 | Tragic 5.8% |
| Nigerians | 0.1 /100 | #265 | Tragic 5.8% |
| Mexican American Indians | 0.1 /100 | #266 | Tragic 5.8% |
| Immigrants | Nigeria | 0.1 /100 | #267 | Tragic 5.8% |
| Immigrants | Sierra Leone | 0.1 /100 | #268 | Tragic 5.8% |
| Immigrants | El Salvador | 0.1 /100 | #269 | Tragic 5.8% |
| Blackfeet | 0.1 /100 | #270 | Tragic 5.8% |
| Mexicans | 0.1 /100 | #271 | Tragic 5.9% |
Demographics Similar to Immigrants from Japan by Unemployment
In terms of unemployment, the demographic groups most similar to Immigrants from Japan are Burmese (4.9%, a difference of 0.020%), Serbian (4.9%, a difference of 0.050%), Paraguayan (4.9%, a difference of 0.070%), Immigrants from Northern Europe (4.9%, a difference of 0.16%), and Immigrants from North America (4.9%, a difference of 0.21%).
| Demographics | Rating | Rank | Unemployment |
| Italians | 98.9 /100 | #64 | Exceptional 4.9% |
| Immigrants | Canada | 98.8 /100 | #65 | Exceptional 4.9% |
| Slovaks | 98.7 /100 | #66 | Exceptional 4.9% |
| New Zealanders | 98.6 /100 | #67 | Exceptional 4.9% |
| Slavs | 98.6 /100 | #68 | Exceptional 4.9% |
| Immigrants | North America | 98.5 /100 | #69 | Exceptional 4.9% |
| Serbians | 98.4 /100 | #70 | Exceptional 4.9% |
| Immigrants | Japan | 98.3 /100 | #71 | Exceptional 4.9% |
| Burmese | 98.3 /100 | #72 | Exceptional 4.9% |
| Paraguayans | 98.3 /100 | #73 | Exceptional 4.9% |
| Immigrants | Northern Europe | 98.2 /100 | #74 | Exceptional 4.9% |
| Turks | 98.0 /100 | #75 | Exceptional 4.9% |
| German Russians | 98.0 /100 | #76 | Exceptional 4.9% |
| Cypriots | 97.9 /100 | #77 | Exceptional 4.9% |
| Okinawans | 97.9 /100 | #78 | Exceptional 4.9% |